






Most procurement teams know roughly where their money goes, yet few can prove it down to the supplier and category level. Spend analysis closes that gap by consolidating every purchase into one reliable dataset that shows exactly who a business buys from, what it buys, and how often.
For Australian businesses managing tighter margins and more suppliers, this visibility drives real savings. As a result, procurement leaders can consolidate suppliers, cut off-contract buying, and negotiate from evidence rather than instinct. This guide explains what spend analysis is, how the process works, the KPIs that matter, and how to build a practice that keeps delivering after the first report.
Key Takeaways
Spend analysis reveals where your money goes across suppliers, categories, and business units, so you can cut costs and reduce risk.
Australian businesses rely on spend analysis to control rising supplier costs, catch off-contract purchases, and negotiate stronger contracts with real numbers.
Accurate analysis depends on clean data from purchase orders, invoices, supplier records, and the general ledger, with consistent category coding.
A regular cycle, monthly or quarterly, catches cost creep early and keeps supplier performance on track.

What Is Spend Analysis in Procurement?
"Spend analysis in procurement turns scattered purchasing data into a clear picture of where every dollar goes, so buying decisions rest on evidence instead of guesswork."
Spend analysis is the practice of collecting, cleansing, classifying, and reviewing an entire company's purchasing data to find savings and reduce risk. It answers three questions with evidence: who does the business buy from, what does it buy, and where can it buy smarter.
The discipline sits at the heart of strategic procurement because decisions built on clean spend data outperform decisions built on assumptions. For example, a business may believe it uses three stationery suppliers when the data reveals eleven, each on different pricing.
Spend analysis differs from basic expense reporting because it standardises and categorises every transaction into a consistent structure. Therefore, a procurement lead can compare like-for-like spend across departments, sites, and time periods rather than reading disconnected invoices.
The output is not a single report but an ongoing capability. When maintained properly, it feeds category strategy, supplier negotiations, and budget planning throughout the year.
Which Records Create a Reliable Spend Dataset?

A spend dataset is only as trustworthy as the records feeding it, so the first task is knowing which sources to pull together. The record types below form the backbone of a complete and defensible spend picture.
Procurement records
Procurement records capture the intent and terms of every purchase before payment occurs. These include purchase orders, purchase requisitions, contracts, and supplier catalogues that define agreed pricing.
Together, they show what a business committed to buy and under which terms. As a result, they reveal whether actual spend matches contracted rates or drifts away from them.
Financial records
Financial records confirm what the business actually paid, which grounds the analysis in real money movement. Accounts payable data, supplier invoices, and general ledger entries all belong in this group.
These records matter because approved spend and paid spend often differ. Therefore, reconciling both sides exposes overpayments, duplicate invoices, and charges that never matched a purchase order.
Supplementary records
Supplementary records add context that pure transaction data cannot provide on its own. Examples include supplier master data, ABN details, category mappings, and corporate card statements for smaller purchases.
This layer helps a business capture spend that hides outside formal procurement channels. Consequently, it brings tail spend and card purchases into a view that would otherwise miss them entirely.
How Does the Spend Analysis Process Work?
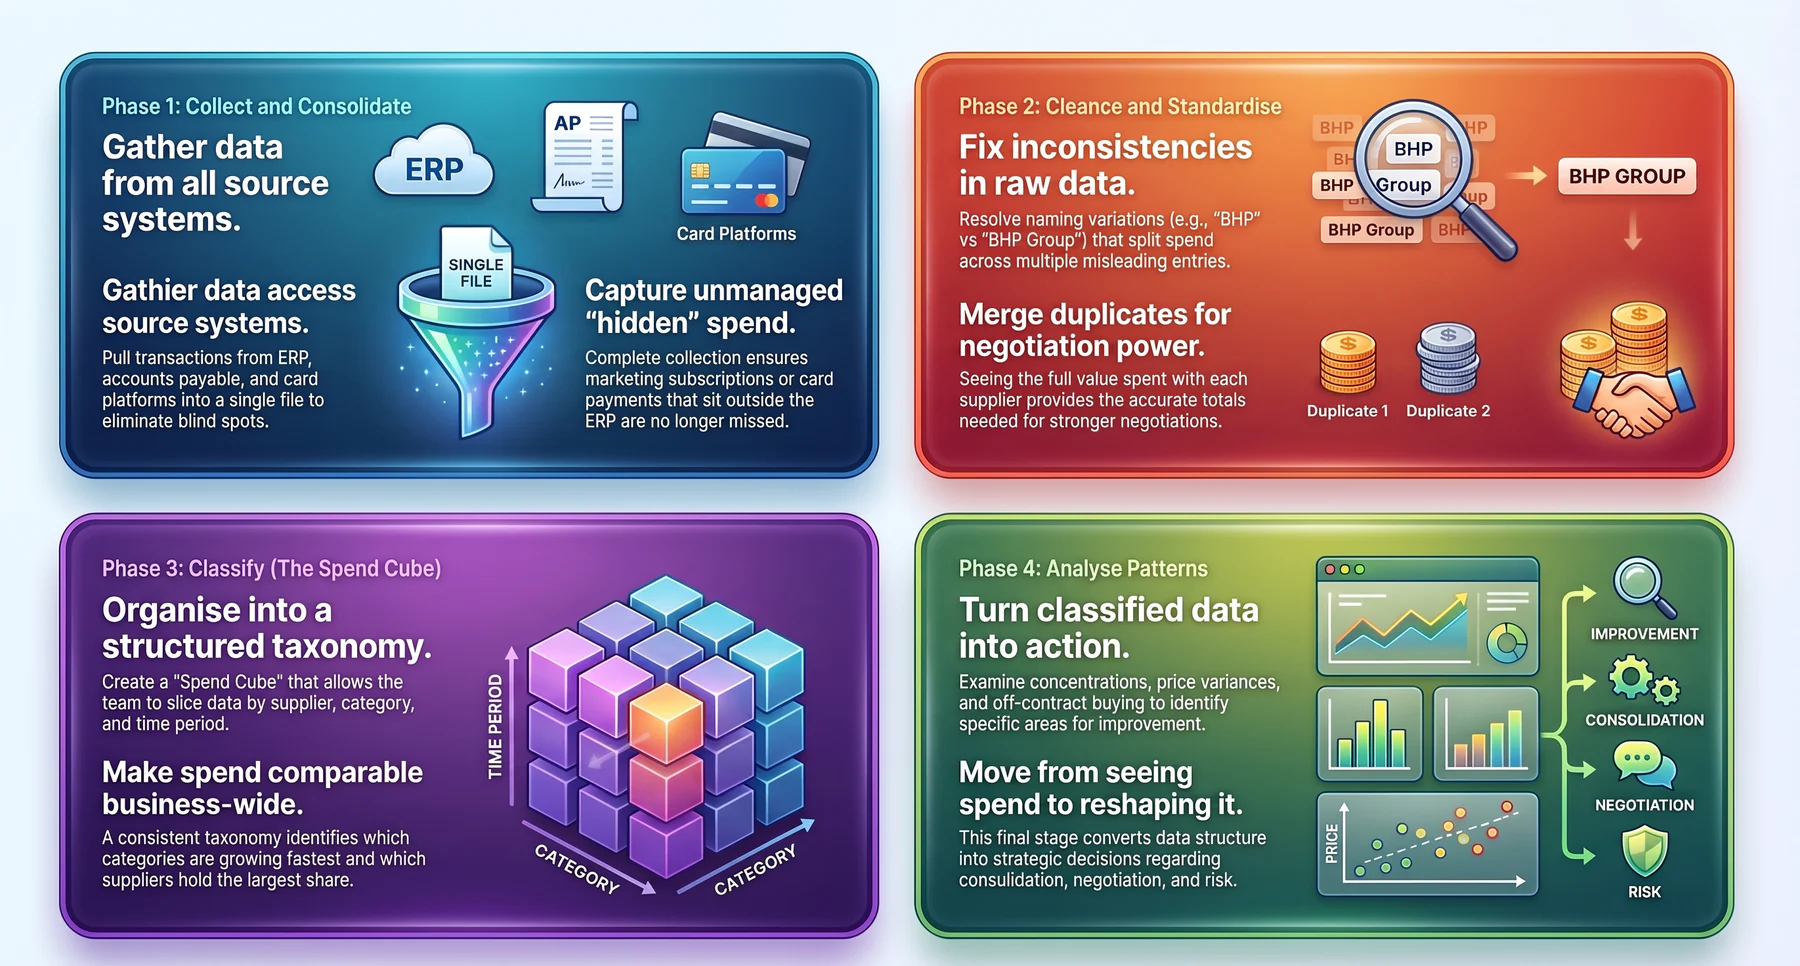
The process moves through four connected activities that turn messy source data into decision-ready insight. Each activity builds on the one before it, so skipping any of them weakens the final result.
1. Collect and consolidate spend data from all source systems
Data collection pulls transactions from every system that records a purchase, including the ERP, accounts payable, and card platforms. A single consolidated file prevents the blind spots that come from analysing one system in isolation.
Complete collection matters because spend scattered across systems tends to escape scrutiny. For example, marketing subscriptions paid by card often sit outside the ERP and slip through unmanaged.
2. Cleanse and standardise supplier names, codes, and categories
Data cleansing fixes the inconsistencies that make raw spend data misleading. The same supplier may appear as "BHP", "BHP Group", and "B.H.P. Ltd", which splits its true spend across three entries.
Standardising names, codes, and units merges these duplicates into one accurate total. Therefore, the business finally sees the full value it spends with each supplier, which strengthens every negotiation that follows.
3. Classify into a spend taxonomy (the spend cube: supplier by category by time)
Classification organises every cleansed transaction into a structured taxonomy, commonly called the spend cube. This structure lets a team slice spend three ways: by supplier, by category, and by time period.
A consistent taxonomy is what makes spend comparable across the whole business. As a result, procurement can answer questions such as which category grew fastest this quarter and which supplier holds the largest share.
4. Analyse patterns, concentrations, and exceptions across the dataset
Analysis is where the classified data becomes insight a business can act on. Here, procurement examines concentrations, price variances, off-contract buying, and supplier fragmentation across the dataset.
This stage converts structure into decisions about consolidation, negotiation, and risk. Consequently, the business moves from simply seeing its spend to actively reshaping it.
Which Spend Categories and Exceptions Should You Examine?
Not all spend behaves the same way, so effective analysis groups purchases by type and hunts for specific red flags. The categories and exceptions below deserve the closest attention during any review.
Direct spend, indirect spend, and tail spend
Spend usually falls into three groups that each demand a different management approach. Understanding the split helps a business apply the right level of effort to each.
- Direct spend: Goods and materials that go straight into what a business sells or produces, such as raw materials for a manufacturer.
- Indirect spend: Purchases that keep operations running without entering the final product, including IT, marketing, and office supplies.
- Tail spend: The large volume of low-value purchases from many suppliers that individually seem minor but collectively drain budget and attention.
Compliance exceptions
Compliance exceptions flag purchases that bypassed the agreed procurement process. The most common example is maverick spend, where staff buy outside approved contracts or without a purchase order.
Catching these exceptions protects negotiated savings that off-contract buying quietly erodes. Therefore, tracking them shows how well the business actually follows its own procurement policy.
Supplier concentration and single-source dependency risk
Supplier concentration reveals how much spend depends on a small number of vendors. When one supplier holds a large share of a critical category, the business carries real continuity risk.
Spotting this dependency early lets a business build backup sourcing before disruption strikes. As a result, spend analysis becomes a risk management tool, not only a savings exercise.
Which Spend Analysis KPIs Support Better Decisions?
The right metrics turn spend analysis from a one-off review into a measurable program. The KPIs below help procurement teams track progress and prove value to finance.
Spend under management and addressable spend ratio
Spend under management measures the share of total spend that procurement actively controls through contracts and sourcing. A higher figure means fewer purchases happen without oversight.
The addressable spend ratio then shows how much remaining spend the team could realistically bring under management. Together, these metrics reveal the size of the opportunity still on the table.
Supplier count per category and PO compliance rate
Supplier count per category exposes fragmentation, since twelve suppliers for one category often signals room to consolidate. Fewer suppliers usually means stronger pricing and simpler management.
PO compliance rate tracks the percentage of spend backed by a proper purchase order. A rising rate shows tighter control, so both metrics together measure procurement discipline across the business.
Maverick spend rate, savings realised, and cost avoidance
These three metrics connect spend analysis to financial outcomes that finance teams recognise. Each one measures a different dimension of program success.
- Maverick spend rate: The proportion of spend made outside approved contracts or processes, where a lower rate reflects better compliance.
- Savings realised: Actual reductions in cost achieved through negotiation, consolidation, or removing waste.
- Cost avoidance: Prevented cost increases, such as blocking a supplier price rise, which protects budget even without cutting spend.
What Does a Practical Spend Analysis Example Look Like?
A worked example shows how the numbers translate into a decision. Consider a mid-sized Australian distributor reviewing its packaging spend across a financial year.
The distributor consolidates its data and finds it spent $480,000 on packaging across nine suppliers. After cleansing, the data reveals that three of those suppliers were actually the same parent company trading under different names.
| Finding | Before Analysis | After Analysis |
|---|---|---|
| Packaging suppliers | 9 separate vendors | 7 true vendors after deduplication |
| Price variance on same item | Up to 18% across suppliers | Standardised to best negotiated rate |
| Off-contract spend | $96,000 unmanaged | Moved under a single agreement |
| Estimated annual saving | Not visible | $52,000 through consolidation |
By consolidating the duplicate suppliers and moving off-contract spend onto one agreement, the distributor projected a $52,000 annual saving. Therefore, a single spend review paid for itself many times over without cutting a single order.
Why Do Spend Analysis Programs Fail After the First Report?
Many businesses run one impressive spend analysis, then watch the momentum fade within months. The failure points below explain why the practice so often stalls after its promising start.
1. Data quality degradation and inconsistent classification over time
Data quality rarely stays clean on its own, since new suppliers and categories enter the system every week. Without ongoing maintenance, the tidy dataset from the first report slowly fills with duplicates and misclassified entries again.
Inconsistent classification then makes period-to-period comparison unreliable. As a result, the numbers lose credibility and teams quietly stop trusting the reports.
2. No governance owner, no refresh cadence
A spend analysis program needs a named owner responsible for keeping it current. When no one holds that role, the dataset ages and nobody schedules the next refresh.
A clear refresh cadence, whether monthly or quarterly, keeps the practice alive. Therefore, assigning ownership is often the difference between a lasting capability and a one-time project.
3. Findings not connected to sourcing decisions or supplier reviews
A spend report only creates value when its findings drive action. Too often, insights sit in a dashboard while sourcing and supplier reviews carry on unchanged.
Connecting findings directly to negotiations and category strategy closes this loop. Consequently, spend analysis shifts from an interesting report into a genuine savings engine.
What Should You Look for in Spend Analysis Software?

The right software determines whether spend analysis stays effortless or becomes a manual burden. The capabilities below separate a genuine spend analysis tool from a basic reporting add-on.
Data connectivity
Data connectivity decides how easily the tool pulls spend from every source system. Strong connectivity links to the ERP, accounts payable, and card platforms without constant manual exports.
Broad connectivity keeps the dataset complete and current with little effort. Therefore, it directly reduces the blind spots that undermine analysis.
Classification and taxonomy capabilities
Classification capability determines how accurately the tool sorts transactions into categories. The best systems use automated classification that learns and improves as it processes more data.
A flexible taxonomy lets a business match categories to its own structure rather than a rigid template. As a result, the analysis reflects how the company genuinely operates.
Australian specific requirements
Australian requirements ensure the tool handles local tax and supplier details correctly. This includes GST treatment, ABN validation, and reporting that aligns with local financial practice.
Software built with these needs in mind saves considerable manual correction. Consequently, it produces cleaner supplier records and more reliable spend totals for Australian businesses.
ERP-integrated vs standalone spend analysis tools
Choosing between an integrated and a standalone tool shapes how much manual effort the practice demands. The comparison below highlights where each option fits a growing business.
| Capability | Standalone Tool | ERP-Integrated |
|---|---|---|
| Data source | Imported from separate systems | Reads live purchase and finance data directly |
| Data freshness | Depends on manual export cycles | Updates as transactions are recorded |
| Setup effort | Requires ongoing data mapping | Uses existing ERP structure |
| Best fit | Businesses with many disconnected systems | Growing businesses wanting a single source of truth |
How HashMicro supports spend analysis in the Purchase module
HashMicro's procurement software captures purchase requisitions, orders, and supplier data in one place, then connects that data to accounting for a complete spend view. Because the data already lives in one system, the classification and reconciliation work that slows standalone tools largely disappears.
The Purchase module lets procurement teams track spend by supplier, category, and period without exporting to a separate platform. As a result, growing Australian businesses gain ongoing spend visibility without hiring a dedicated analytics team.
On top of the Purchase module, Hashy OS reads your connected procurement and accounting data through the Company Nexus. Hashy, your AI coworker, then surfaces spend concentrations, flags off-contract purchases, and answers spend questions in plain language without a manual data pull.






How Can You Build an Ongoing Spend Analysis Practice?
A lasting practice depends on habits and ownership, not on a single well-produced report. The actions below keep spend analysis delivering value quarter after quarter.
1. Set a refresh cadence and assign a clear data owner
A defined refresh cadence keeps the dataset current and comparable over time. Whether the business refreshes monthly or quarterly, a fixed rhythm prevents the data from ageing into irrelevance.
Assigning one clear owner ensures the refresh actually happens. Therefore, the practice survives staff changes and competing priorities rather than fading after the first review.
2. Connect findings to category strategy and supplier performance reviews
Findings create value only when they shape real procurement decisions. Feeding spend insights into category planning and supplier reviews turns analysis into negotiation leverage.
This connection keeps the whole exercise grounded in outcomes. Consequently, each review cycle produces concrete actions rather than another dashboard nobody uses.
3. Benchmark against targets and escalate exceptions before they compound
Benchmarking spend against clear targets shows whether the program is genuinely improving. Comparing current results to prior periods and goals keeps progress visible to leadership.
Escalating exceptions early stops small issues from growing into large ones. For example, flagging a creeping maverick spend rate lets a business correct behaviour before it erodes a full year of savings.
Conclusion
Spend analysis gives Australian procurement teams the evidence they need to consolidate suppliers, cut off-contract buying, and negotiate from a position of strength. The real value comes not from a single report but from an ongoing practice with a clear owner, a steady refresh cadence, and findings that reach every sourcing decision.
When spend data already lives inside your purchasing and finance systems, keeping that practice current becomes far simpler. To see how integrated procurement and spend visibility could work for your business, schedule a free consultation with HashMicro.
Frequently Asked Questions
Spend analysis is the process of collecting, cleaning, and reviewing your procurement data to see where money goes across suppliers, categories, and business units. It gives you a clear picture of total spend so you can find savings, reduce risk, and negotiate better contracts.
Australian businesses face rising supplier costs, tighter margins, and stronger compliance expectations. Spend analysis helps you control costs, spot off-contract purchases, and make decisions based on real numbers rather than guesswork.
You need purchase orders, invoices, supplier records, and general ledger entries at a minimum. Clean and consistent category coding makes the analysis far more accurate, which is why many teams pull this data straight from their ERP.
Most businesses review spend monthly or quarterly, with a deeper annual review before contract renewals. Running it on a regular cycle helps you catch cost creep early and keep supplier performance on track.
Spend analysis is the review of past spending to find patterns and savings. Spend management is the broader practice of controlling spend going forward through policies, approvals, and supplier strategy, and it uses spend analysis as its foundation.
Software pulls procurement and accounting data into one place, categorises it automatically, and updates dashboards in real time. This removes manual spreadsheet work and gives you accurate spend visibility without a dedicated analytics team.