









 Limited to 100 registrants

Project cost overruns and schedule delays cost Australian businesses and government agencies billions of dollars each year. Earned Value Management (EVM) is a structured performance measurement method that gives project managers objective, early-warning data on whether a project is on track.
Unlike basic cost tracking, EVM integrates scope, schedule, and cost into a single view, making it one of the most reliable tools available to project professionals. This guide explains what EVM is, how to apply the core formulas, how Australian Standard AS4817:2019 applies, and how project management software supports consistent EVM reporting.
Key Takeaways
EVM combines scope, schedule, and cost data into one integrated performance framework, giving project leaders a more complete picture than cost tracking alone.
A Cost Performance Index (CPI) below 1.0 means the project is spending more than the value of work delivered, and this inefficiency tends to persist without corrective action.
Australian Standard AS4817:2019 governs EVM practice in Australia and aligns with international frameworks used by defence, infrastructure, and government agencies.
Project management software automates EVM calculations, reducing manual effort and enabling real-time performance visibility across the project lifecycle.

What Is Earned Value Management in Project Control?
"Earned value management provides the project manager with an early warning signal when the project is not performing to plan, allowing corrective action to be taken while there is still time to recover."
Earned Value Management is a project performance measurement technique that integrates scope, schedule, and cost data into a single reporting framework. Project managers use it to answer two critical questions at any point in a project: is the work ahead or behind schedule, and is the project spending more or less than what the completed work is worth?
Traditional budget reporting compares planned spending against actual expenditure. EVM introduces a third data point: the budgeted value of work that has been completed. This additional measurement resolves the ambiguity that a simple spending comparison cannot. A project that has consumed 50% of its budget may be delivering on time, or it may have completed only 30% of the required scope.
In a project control context, EVM forms part of a broader Earned Value Management System (EVMS). An EVMS defines the rules for how work is planned, budgeted, measured, and reported throughout a project's life. Many large infrastructure and defence contracts in Australia require an EVMS as a formal condition of the agreement.
What Are the Three Core EVM Components?
Every EVM calculation begins with three fundamental data points collected from the project's approved baseline and the current status of work. These three components are the building blocks for every metric, index, and forecast in the system.
1. Planned Value (PV)
Planned Value is the authorised budget assigned to scheduled work up to a specific point in time. It represents the answer to the question: how much work did we plan to have completed by now, measured in dollar terms?
PV is sometimes called the Budgeted Cost of Work Scheduled (BCWS). The project team establishes PV during baseline development by distributing the total approved budget across the project timeline according to the approved schedule. Every reporting period has a defined PV that reflects how much value should have been delivered by that date.
2. Earned Value (EV)
Earned Value is the budgeted amount for work that has actually been completed, regardless of what it cost to do that work. It answers the question: how much budget have we earned by completing what we have actually delivered?
Also called the Budgeted Cost of Work Performed (BCWP), EV is calculated by multiplying the completion percentage of each work package by its total approved budget. EV is the central metric in EVM because it directly connects budget to output rather than to expenditure. It is the only one of the three components that reflects what has been physically produced.
3. Actual Cost (AC)
Actual Cost is the total expenditure incurred for work performed during a given period. It captures all real costs charged to the project, including labour, materials, equipment, subcontractors, and other direct costs.
Also referred to as the Actual Cost of Work Performed (ACWP), AC is compared against EV to reveal whether the project is spending efficiently. When AC exceeds EV for the same work, the project is over budget for what it has delivered. When EV exceeds AC, the project is delivering work for less than planned.
What Are the Essential EVM Formulas and Metrics?

EVM generates a structured set of metrics from its three core components. Some metrics measure variance from the plan in dollar terms, others express efficiency as a ratio, and a third group uses current performance data to forecast final project outcomes.
Variance Metrics
Variance metrics compare actual project performance against the baseline and return a positive or negative dollar result. A positive variance is favourable; a negative variance signals a performance issue that warrants investigation.
The two primary variance calculations are:
- Schedule Variance (SV) = EV - PV. A positive SV means more work has been completed than planned. A negative SV indicates the project is behind the schedule baseline.
- Cost Variance (CV) = EV - AC. A positive CV means the project is spending less than what the completed work is worth. A negative CV indicates cost overrun relative to the work delivered.
Performance Indices
Performance indices convert variance data into dimensionless ratios that allow meaningful comparison across projects of different sizes and contract values. They are particularly useful for identifying performance trends over multiple reporting periods.
The two core efficiency indices are:
- Cost Performance Index (CPI) = EV / AC. A CPI of 1.0 means each dollar spent returns a dollar of earned value. A CPI below 1.0 means the project is receiving less value than it is spending; a CPI above 1.0 means it is operating more efficiently than planned.
- Schedule Performance Index (SPI) = EV / PV. An SPI of 1.0 means work is progressing exactly as scheduled. An SPI above 1.0 means the project is ahead; below 1.0 means it is behind.
Forecasting Metrics
Forecasting metrics apply current performance data to estimate how the project will finish. They provide an objective, formula-based view of likely final cost and the efficiency required to remain within the approved budget.
The key forecasting calculations are:
- Budget at Completion (BAC): the total approved project budget, established at baseline.
- Estimate at Completion (EAC) = BAC / CPI. Projects the total cost if current cost performance continues for the remainder of the work.
- Estimate to Complete (ETC) = EAC - AC. The expected cost to finish all remaining work from the current date.
- Variance at Completion (VAC) = BAC - EAC. A negative VAC projects a final cost overrun against the approved budget.
To-Complete Performance Index (TCPI) = (BAC - EV) / (BAC - AC). The cost efficiency the project must achieve on remaining work to finish within the original budget.
How Do You Calculate Earned Value? Full Worked Example
Applying the formulas to a realistic scenario shows how the metrics work together to tell a performance story. The following example uses a commercial office fitout project to demonstrate each calculation and its practical meaning.
1. Project Scenario
A business commissions a commercial office fitout with a total approved budget (BAC) of $200,000 and a planned duration of 10 weeks. At the end of week 5, the project team collects the following status data.
- Planned Value (PV): $100,000, because the midpoint of a 10-week project should represent 50% of the total budget.
- Earned Value (EV): $80,000, because the team has completed only 40% of the total scope despite being at the halfway point.
- Actual Cost (AC): $90,000, which is the actual expenditure recorded to date.
2. Calculating Each Metric
With the three data points confirmed, each EVM metric follows directly. The calculations move in sequence from variance analysis through to efficiency indices and then to final cost forecasts.
Variance calculations:
- SV = EV - PV = $80,000 - $100,000 = -$20,000 (behind schedule)
- CV = EV - AC = $80,000 - $90,000 = -$10,000 (over budget for work done)
Performance indices:
- CPI = EV / AC = $80,000 / $90,000 = 0.89
- SPI = EV / PV = $80,000 / $100,000 = 0.80
Forecasting calculations:
- EAC = BAC / CPI = $200,000 / 0.89 = $224,719
- ETC = EAC - AC = $224,719 - $90,000 = $134,719
- VAC = BAC - EAC = $200,000 - $224,719 = -$24,719
- TCPI = ($200,000 - $80,000) / ($200,000 - $90,000) = $120,000 / $110,000 = 1.09
3. Interpreting the Results in Plain English
Every metric in this example points in the same direction: the project is in difficulty on both schedule and cost. The negative SV confirms that less work has been completed than planned, and the negative CV confirms that the work delivered has cost more than it was budgeted to cost.
The CPI of 0.89 means that for every dollar spent, only 89 cents of budgeted work is being delivered. If that efficiency rate continues, the project will finish at approximately $224,719, roughly $25,000 above the approved budget. The TCPI of 1.09 means the delivery team needs to be 9% more cost-efficient on all remaining work than it has been to date, which is a demanding recovery target mid-project.
These numbers point clearly to the need for immediate investigation into the causes of both the cost overrun and the schedule delay, before the variance compounds further.
How Should Project Leaders Interpret EVM Results?
EVM metrics are diagnostic tools rather than definitive verdicts. Effective project leaders use them as the starting point for analysis and reserve major decisions for after they have investigated the underlying causes.
A CPI between 0.9 and 1.1 is widely considered to fall within an acceptable performance range on most projects. Values outside this band are worth investigating, but a single-period reading should not drive major decisions. A trend across three or more consecutive reporting periods is far more informative than any single data point.
The SPI is a reliable indicator of schedule performance in the early and middle stages of a project but becomes less useful near completion. As a project approaches 100% complete, all remaining work converges toward done, which causes the SPI to drift toward 1.0 even when the project remains behind schedule. In the final 20% of a project's timeline, schedule network analysis should complement EVM schedule data rather than replace it.
Project leaders should also consider the nature of the work when interpreting indices. Labour-intensive packages can show CPI volatility due to overtime or productivity fluctuations, while fixed-price subcontract packages may display stable indices regardless of what the subcontractor is actually experiencing. Reviewing performance at the control account level produces more reliable insights than relying solely on top-level indices.
What EVM Baseline Information Do You Need Before Reporting Starts?
EVM data is only as reliable as the baseline it measures against. Before the first reporting period opens, three foundational elements must be formally established and approved.
Work Breakdown Structure (WBS) and Control Accounts
The Work Breakdown Structure is a hierarchical decomposition of total project scope into manageable, measurable components. Each element in the WBS represents a discrete deliverable or work package with a defined budget, schedule, and responsible party assigned.
Control accounts sit at the intersection of the WBS and the project schedule. Each control account is assigned to a control account manager and carries its own budget and schedule baseline. The control account is the primary unit at which EVM performance data is collected, calculated, and reported. Without a well-structured WBS and clearly defined control accounts, EVM calculations lack the precision needed to support meaningful analysis.
Performance Measurement Baseline (PMB)
The Performance Measurement Baseline is the time-phased budget that the project team measures performance against throughout the project's life. It is formed by summing the budgets of all control accounts and distributing them across the timeline in alignment with the approved schedule.
The PMB must be formally approved before the first work package begins and should only be revised through a controlled change management process. An unstable or unapproved baseline makes it impossible to distinguish genuine performance variances from baseline errors, which undermines the credibility of all subsequent EVM reports.
Progress Measurement Rules
Progress measurement rules define how each work package quantifies and reports percentage complete. Consistent rules are essential because different interpretations of progress can produce materially different EV values from the same physical work.
The most common progress measurement methods are as follows.
- Fixed Formula (0/100 or 50/50): A work package earns no EV credit until it is complete under the 0/100 method, or earns a fixed proportion at start and the remainder at finish under the 50/50 method. Both approaches eliminate subjective estimation.
- Weighted Milestones: EV is credited at predefined project milestones, with each milestone carrying a weighted budget value that reflects the work it represents.
- Percent Complete: The responsible manager estimates progress based on physical inspection or measurable outputs. This method is flexible but requires oversight to prevent optimistic reporting.
- Level of Effort: Used for ongoing support activities where discrete output cannot be directly measured. EV automatically equals PV each period, so this method does not reveal genuine performance variance.
Earned Value Management in Australian Projects

EVM has a well-established place in Australian project delivery, particularly in government, defence, and major infrastructure. Project professionals working in these sectors need to understand both the relevant standard and the contract conditions that apply to their work.
1. Australian Standard AS4817:2019
AS4817:2019, titled "Project performance measurement using Earned Value," is the primary Australian standard governing EVM practice. Published by Standards Australia, it aligns with the American ANSI/EIA-748 standard and international frameworks, making Australian EVM practice broadly compatible with approaches used by major trading partners.
The standard sets out requirements for establishing a compliant EVMS, covering baseline definition, progress measurement, variance reporting, and management review processes. It also addresses surveillance requirements for projects where a client or funding authority requires independent review of EVM data quality and integrity.
2. When Is EVM Mandatory in Australian Contracts?
EVM is not universally required in Australia, but it is mandatory on a substantial range of government and defence contracts. The Department of Defence mandates EVM on major capital acquisition projects above defined dollar thresholds, with requirements aligned to AS4817:2019.
Several state and federal infrastructure agencies have also incorporated EVM requirements into their project frameworks. Infrastructure NSW, Transport for NSW, and federal agencies procuring large construction projects increasingly include EVM reporting obligations in their contracts. Specific thresholds and the level of EVMS sophistication required vary by agency, contract type, and project value, so project teams should always review their contract documentation rather than assuming a uniform standard applies.
3. Which Australian Industries Use EVM?
EVM originated in defence procurement but has expanded across a wide range of Australian industries over the past two decades. The following sectors regularly apply EVM principles on major projects.
- Defence and aerospace: EVM is embedded in major capability acquisition contracts managed through the Department of Defence, where formal EVMS compliance is often a contractual requirement.
- Infrastructure and civil construction: Road, rail, and water infrastructure projects use EVM for client reporting and internal performance management on large capital programmes.
- Resources and energy: Large-scale mining and energy developments apply EVM to manage schedule and cost performance across multi-year capital programmes.
- Information technology: Federal and state government IT programmes above defined thresholds increasingly include EVM reporting as part of their governance requirements.
- Healthcare infrastructure: Major hospital and health facility projects use EVM to track performance across complex multi-year delivery programmes involving multiple contractors and funding streams.
What Business Benefits Can EVM Deliver?
EVM delivers practical benefits that extend well beyond regulatory compliance. For project-driven businesses, the primary value lies in early detection, objective measurement, and reliable forecasting of final outcomes.
Early identification of negative variances gives project leaders time to intervene before problems escalate. A CPI trending below 1.0 in the second reporting period of a six-month project creates far more options for recovery than the same finding discovered in the final month. EVM converts performance data into actionable intelligence while corrective action is still feasible.
Objective metrics also reduce the ambiguity that often accompanies subjective progress reporting. Rather than relying on verbal assurances or percentage-complete estimates from the delivery team, sponsors and clients receive formula-derived data that can be audited, trended, and compared across projects. This transparency strengthens stakeholder confidence and reduces the frequency of scope and cost disputes.
EVM forecasting methods consistently outperform traditional bottom-up re-estimates in accuracy. Research across large capital project datasets shows that the CPI established at the 20% completion mark is a strong leading indicator of final project cost. Businesses that rely on EVM-based forecasts make better-informed decisions about contingency drawdown, contract variations, and resource allocation than those relying on periodic re-estimates alone.
How Can You Implement EVM in Your Business?
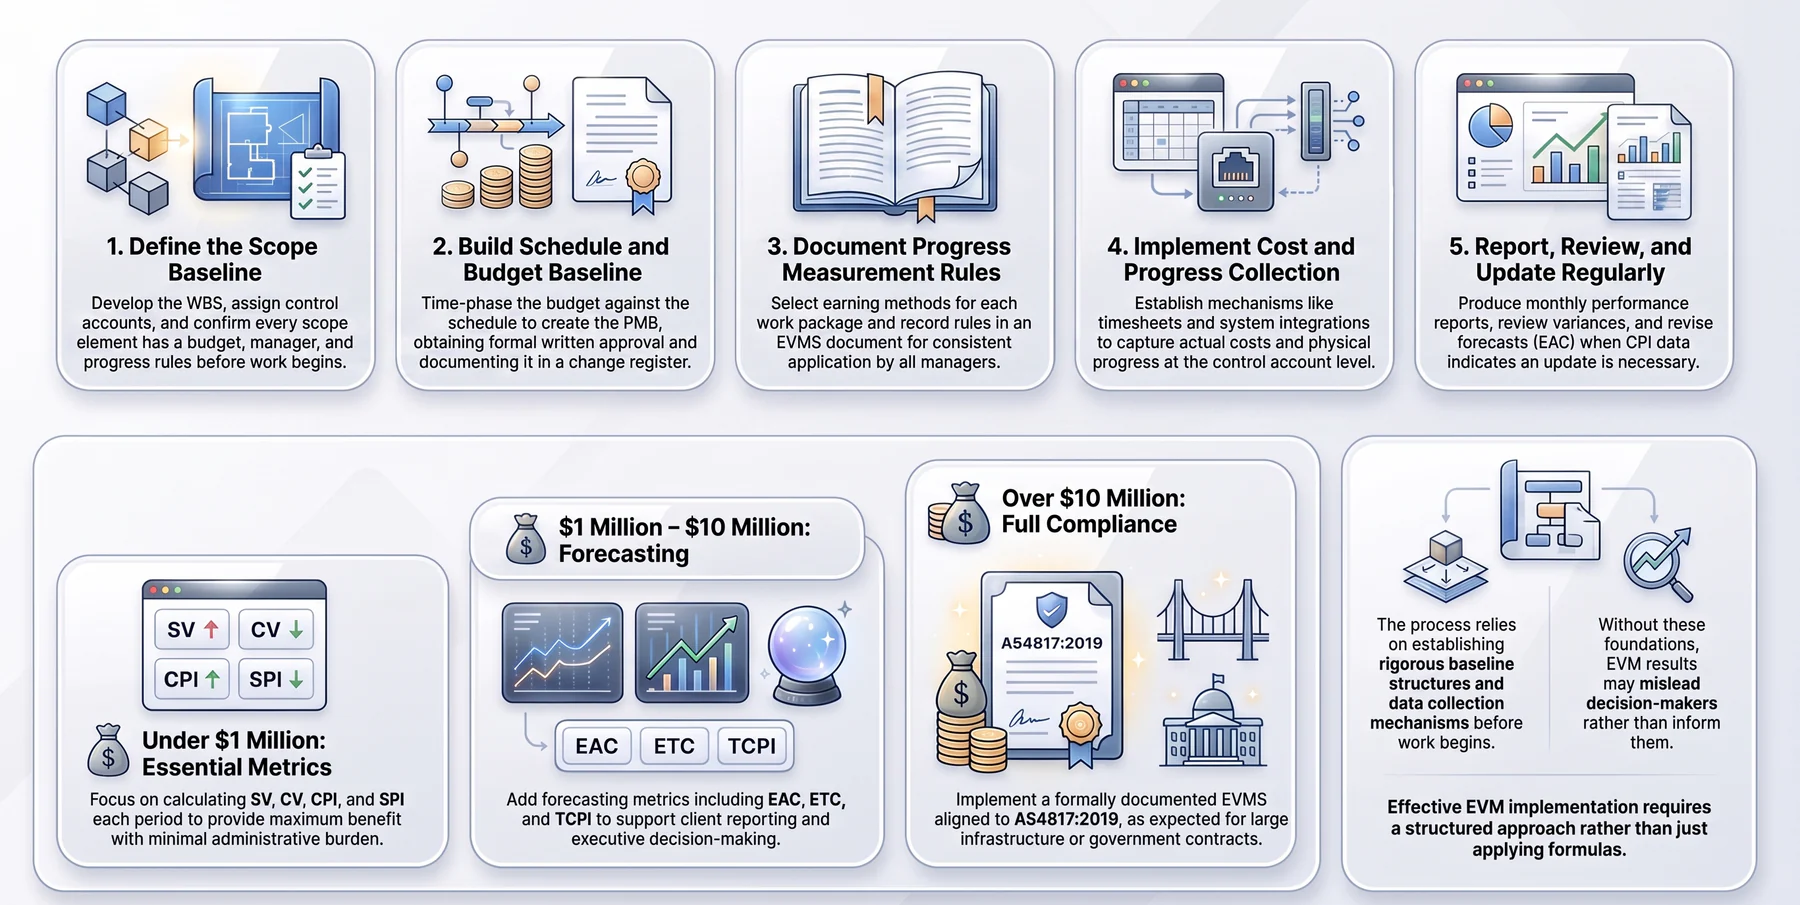
Implementing EVM requires a deliberate approach rather than simply adopting the formulas. Without the right baseline structures and data collection processes in place, the calculations will produce unreliable results that mislead rather than inform.
The EVMS Implementation Path
A structured implementation sequence reduces the risk of gaps in the baseline and ensures that data collection processes are operational before the first reporting period begins.
The five activities in an EVMS implementation are:
- Define the scope baseline. Develop the WBS, assign control accounts, and confirm that every element of project scope has a defined budget, a responsible manager, and agreed progress measurement rules before any work commences.
- Build the schedule and budget baseline. Time-phase the approved budget against the project schedule to create the PMB. Obtain formal written approval before work begins, and document the approval in a baseline change control register.
- Document progress measurement rules. Select an appropriate earning method for each work package type and record the rules in an EVMS description document that all control account managers understand and apply consistently.
- Implement cost and progress collection. Set up the mechanisms for capturing actual cost and reporting physical progress at the control account level, using timesheets, purchase orders, or system integrations as appropriate to the project's reporting environment.
- Report, review, and update regularly. Produce EVM performance reports at a defined frequency, typically monthly, review variances above a defined threshold with control account managers, and revise forecasts when current CPI data warrants an updated EAC.
Scaling EVM to Your Project Size
A full EVMS aligned to AS4817:2019 is appropriate for large, complex projects but adds unnecessary overhead to smaller work. Most businesses benefit from matching EVM complexity to the risk and value of each project.
For projects under $1 million, calculating SV, CV, CPI, and SPI each reporting period provides most of the benefit with minimal administrative burden. For projects between $1 million and $10 million, adding forecasting metrics such as EAC, ETC, and TCPI supports client reporting and executive decision-making. Above $10 million, and particularly on government or infrastructure contracts, a formally documented EVMS aligned to AS4817:2019 is appropriate and increasingly expected by clients and principals.
How Does Project Management Software Support EVM?
Manual EVM is feasible for simple projects but becomes error-prone as scope and team size grow. Project management software automates the data collection, calculation, and reporting processes that EVM requires, removing the bottleneck that spreadsheet-based tracking creates.
Effective EVM software integrates with cost management, scheduling, and time-tracking systems so that PV, EV, and AC data update automatically as work progresses and costs are recorded. This removes the manual data-gathering effort that typically delays reporting cycles and introduces transcription errors. As a result, project managers can access current EVM metrics at any point in the reporting period rather than waiting for the monthly cut-off.
Reporting dashboards display EVM metrics with visual trend charts that make CPI and SPI movements easy to interpret at a glance. Threshold-based alerts notify project managers when a metric moves outside an acceptable band, enabling faster escalation to the right decision-makers. Some platforms also generate EVM-formatted reports that meet the documentation requirements of AS4817:2019 compliant programmes.
Conclusion
Earned Value Management gives project-driven businesses a reliable, formula-based method for measuring progress, detecting performance issues early, and forecasting final cost with confidence. For Australian businesses, understanding the three core components, the essential formulas, and the key requirements of AS4817:2019 provides a strong foundation for compliant and effective project control.
When manual tracking limits the quality or frequency of EVM reporting, project management software provides the integration and automation needed to maintain consistent performance visibility. Schedule a free consultation to find out how its project management platform supports EVM for growing Australian businesses.

Frequently Asked Questions
Manual progress reporting can support reliable EVM when the organisation defines consistent measurement rules, requires supporting evidence and records review and approval history. Unsupported percentage-complete estimates weaken earned value, CPI and SPI even if every formula is calculated correctly. Periodic sampling and reconciliation can help reviewers identify subjective or inconsistent progress claims.
Actual cost normally reflects costs posted under the organisation’s accounting and EVM policies, while commitments represent future exposure from purchase orders or subcontracts. Showing commitments alongside AC can give leaders a more complete forecast view, but commitments should remain clearly labelled rather than being silently included in AC unless the approved reporting policy defines that treatment.
CPI compares earned value with actual cost, while SPI compares earned value with planned value. A project can therefore remain close to schedule while spending more than planned. It can also appear under budget because work has been delayed and less value has been earned. The two indices should be reviewed together with source records and the detailed schedule.
The CFO should ask whether cost coding is complete, whether open commitments and approved variations are included, what productivity assumptions support the remaining forecast and whether the original baseline is still valid. The review should also identify which EAC formula was used and whether current cost performance is reasonably expected to continue.
ERP software can automate data collection, formulas and reporting when project budgets, procurement, labour, inventory and accounting records use consistent structures and reporting periods. It cannot independently confirm that physical scope is complete or decide whether a baseline change should be approved. Those decisions still require accountable governance.