






Average revenue per user (ARPU) measures how much revenue a business generates from each active user during a defined monthly, quarterly, or annual period.
Businesses calculate it by dividing total revenue by active users for the same period. The result shows how effectively pricing and monetisation convert users into revenue.
Key Takeaways
ARPU measures the average revenue generated by each active user during a defined period, helping businesses assess monetisation performance.
Consistent revenue and user definitions make ARPU calculations reliable and comparable across reporting periods."
Comparing ARPU within the same customer segment provides a more useful benchmark than relying on a universal target.
Tiered pricing and flexible billing can increase ARPU through premium plans, usage charges, annual commitments, and timely upsells.

What Is Average Revenue Per User (ARPU)?
Average revenue per user measures the average revenue generated by each user or subscriber. SaaS, telecom, subscription, mobile app and media businesses use it to track monetisation.
Total revenue shows overall earnings, while ARPU shows the average contribution per user. If users grow while ARPU falls, the business may be attracting lower-value customers.
Founders, product managers, finance teams and investors use ARPU to assess pricing and revenue quality. They often review it with other key performance indicators, including customer acquisition cost and lifetime value.
The ARPU Formula
The formula is straightforward, but its inputs vary by business model and reporting period. Using consistent revenue and user definitions makes ARPU reliable and comparable.
ARPU = Total Revenue ÷ Total Active Users
For SaaS businesses, Stripe Billing analytics calculates ARPU by dividing total MRR by active subscribers:
Monthly ARPU = Monthly Recurring Revenue ÷ Total Paying Subscribers
For annual reporting:
Annual ARPU = Annual Recurring Revenue ÷ Total Paying Subscribers
SaaS ARPU usually includes recurring revenue and excludes one-off setup fees. Mobile apps may include subscriptions, in-app purchases and advertising revenue.
Define active users consistently. Paying subscribers and all registered users produce different results, so changing the denominator makes comparisons unreliable.
Revenue and user counts must cover the same period. Combining monthly revenue with quarterly user data produces a misleading result.
Worked examples
A SaaS company generates AUD 500,000 in monthly recurring revenue from 2,000 paying subscribers:
Monthly ARPU = AUD 500,000 ÷ 2,000 = AUD 250
A mobile app generates AUD 75,000 in quarterly revenue from 50,000 active users:
Quarterly ARPU = AUD 75,000 ÷ 50,000 = AUD 1.50
A B2B software company generates AUD 1.2 million in annual recurring revenue from 400 paying accounts:
Annual revenue per account = AUD 1,200,000 ÷ 400 = AUD 3,000
The final example uses paying accounts rather than individual users. Therefore, it is technically an ARPA calculation and should be labelled accordingly in financial reporting and product analysis.
ARPU vs ARPA: Which Metric Should You Track?
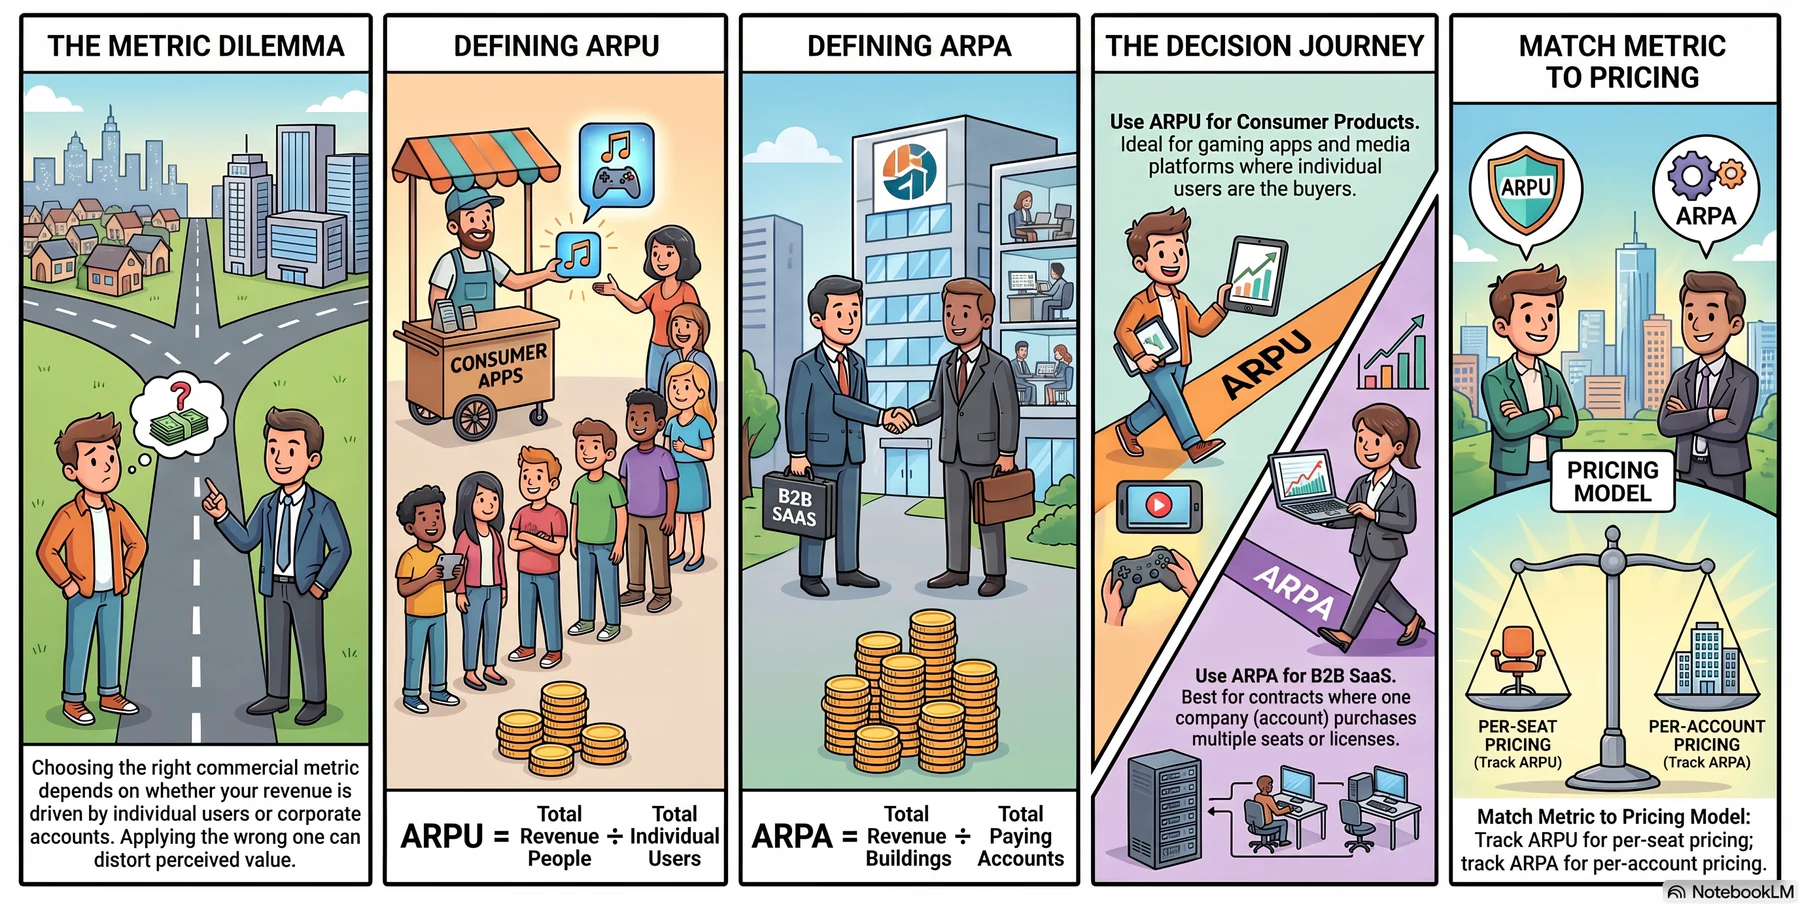
ARPU and ARPA measure different commercial units. Use ARPU when revenue comes from individual users and ARPA when the customer account is the buying unit.
ARPU = Total Revenue ÷ Total Individual Users
ARPA = Total Revenue ÷ Total Paying Accounts
ARPU suits consumer apps, mobile games, media platforms and products that charge per user. A gaming app earning AUD 50,000 from 500,000 users has an ARPU of AUD 0.10.
ARPA suits B2B SaaS when the customer account is the buying entity. If one company purchases 50 seats under one contract, ARPA better reflects its commercial value.
Track ARPU when pricing is based on users or seats, and ARPA when pricing is based on customer accounts. Whichever metric you select, apply the same definition consistently.
What Is a Good ARPU? 2026 Benchmarks by Segment
There is no universal ARPU target because pricing, customer size and user definitions vary widely. Current B2B SaaS pricing benchmarks show why results should be compared within the same market segment.
For account-based SaaS, the figures below are closer to ARPA than individual-user ARPU. All amounts are indicative monthly figures in USD.
| Segment | Monthly ARPU Range | Notes |
|---|---|---|
| Self-service / PLG SaaS | USD 20–50 | Low pricing, high user volume and minimal sales involvement |
| SMB SaaS | USD 100–300 | Low-touch or direct sales with shorter sales cycles |
| Mid-market SaaS | USD 2,000–5,000 | Higher account value with expansion revenue opportunities |
| Enterprise SaaS | USD 4,000–12,500+ | Larger contracts, complex sales cycles and higher retention expectations |
| Usage-based SaaS | USD 50–200 average | Revenue increases as customers consume more of the product |
A useful ARPU benchmark compares historical trends with direct competitors in the same customer segment. Comparing self-service and enterprise software can create unrealistic pricing expectations.
ARPU should also be assessed against customer acquisition cost. At USD 250 monthly ARPU, a USD 3,000 CAC equals 12 months of revenue, while gross margin makes the actual payback period longer.
Why ARPU Matters for Business Decisions
ARPU is not a vanity metric. As one of the key performance indicators for monetisation, it links user value with pricing, product priorities, investor reporting and the sustainability of the growth model.
- Pricing and packaging decisions: Rising ARPU suggests that new prices or tiers are working. If ARPU falls as users grow, customers may favour lower-priced plans.
- Investor and board reporting: ARPU helps assess monetisation quality. Reviewing it with LTV, CAC and churn provides a clearer view of revenue performance.
- Product roadmap prioritisation: Features that drive upgrades, usage or retention can raise ARPU. Cohort tracking shows which changes create lasting results.
- M&A and valuation: ARPU helps buyers assess the value of an existing user base. Combined with subscriber numbers, it provides a clearer view of revenue quality.
"ARPU becomes useful when revenue, user and reporting-period definitions stay consistent. That consistency turns a simple average into a reliable pricing signal."
How to Improve ARPU
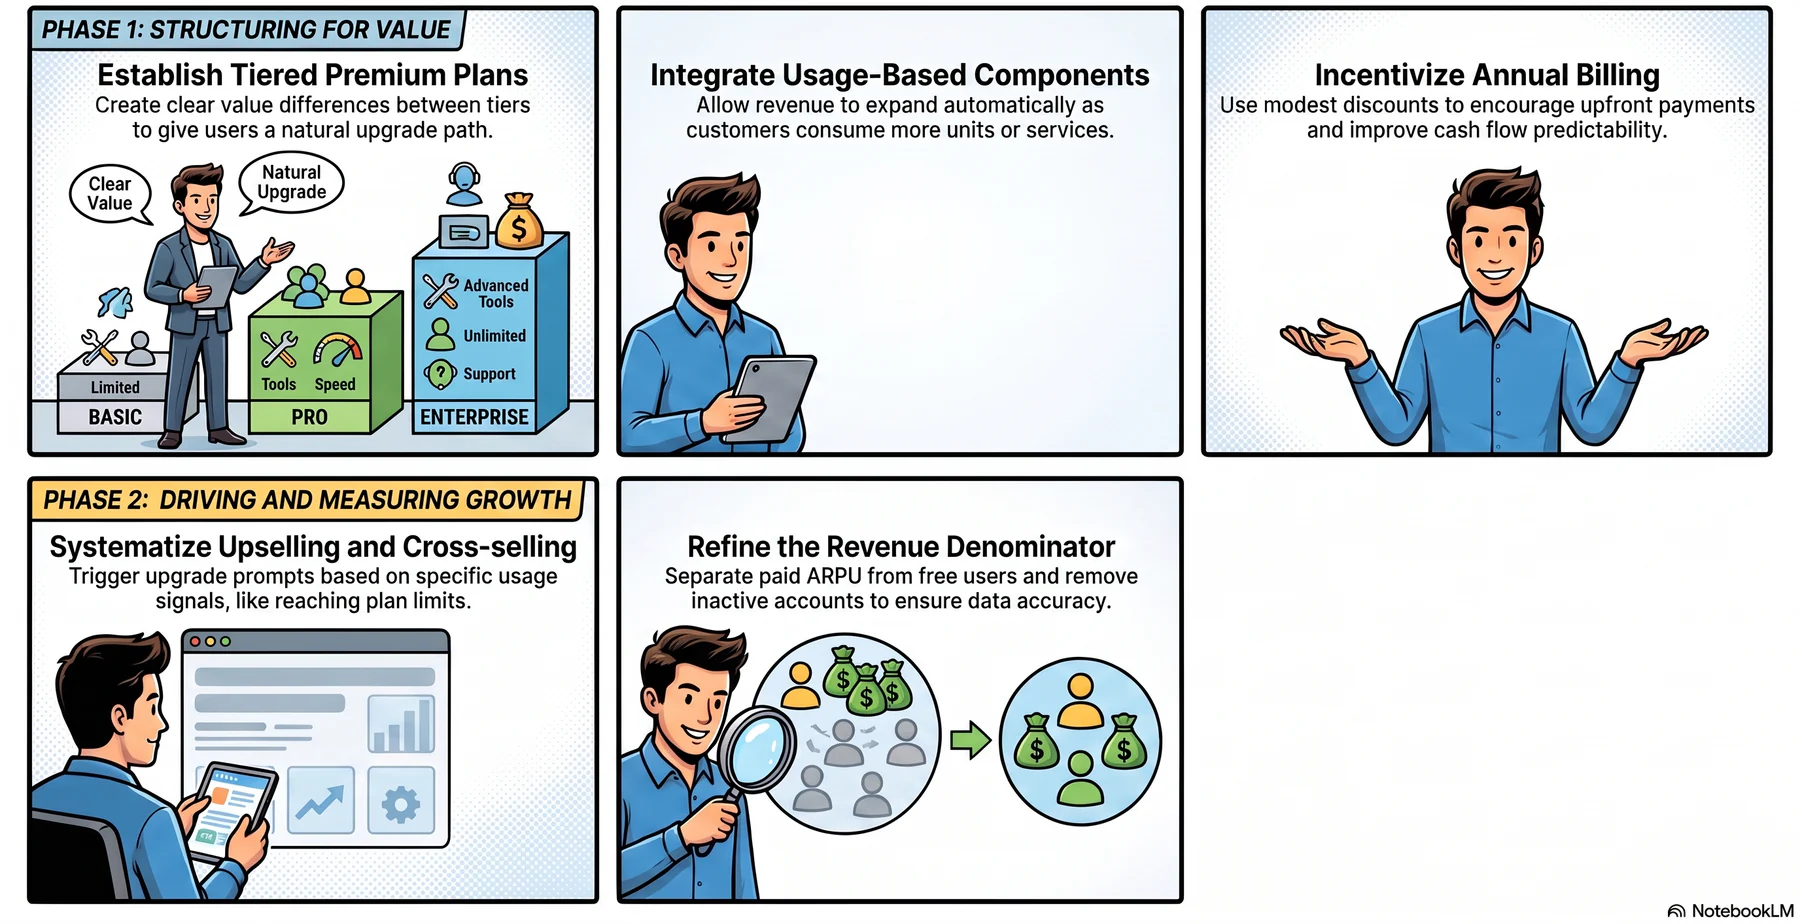
Improving ARPU can be more capital-efficient than acquiring users. A 10% ARPU increase creates the same revenue gain as 10% user growth, often with less acquisition spending.
1. Tiered pricing and premium plans
Clear plan differences give higher-value users a natural upgrade path. Each tier should provide enough added value to justify its price without weakening the entry plan.
Review feature access, usage limits and support levels regularly. If most users remain on the lowest tier, premium plans may lack a clear reason to upgrade.
2. Usage-based pricing components
Usage-based pricing allows revenue to expand as customers consume more. It can complement subscription plans without requiring users to move immediately to a higher tier.
Keep usage units, limits and charges transparent. Complex pricing can discourage adoption and make monthly costs harder for customers to predict.
3. Annual billing incentives
Annual plans encourage longer commitments and improve cash flow predictability. A modest discount can make upfront payment attractive without weakening monthly pricing.
Compare annual and monthly cohorts to confirm that the incentive improves revenue quality, retention and customer value over time.
4. Upsell and cross-sell systematically
Feature gates, in-product prompts and customer success reviews can guide users towards suitable upgrades. Recommendations should reflect their needs and activity.
Use CRM analytics to time each offer around clear usage signals, such as reaching a plan limit or adopting an advanced feature. This makes the upgrade more relevant.
5. Clean up non-paying users in the denominator
A large free-user base can reduce blended ARPU even when paying-user revenue is healthy. Report paid ARPU separately to show actual monetisation performance.
Businesses can also use targeted prompts to move engaged free users towards paid plans. Inactive users should not remain in the active-user denominator.
ARPU and Related Metrics: How They Connect
ARPU does not explain monetisation alone. Reading it with related metrics adds context about customer quality, acquisition efficiency, retention and lifetime value.
1. ARPU and LTV (lifetime value)
Lifetime value can be estimated as ARPU × gross margin × average customer lifetime. This connects monetisation with profitability and retention.
If margin and retention stay stable, a 20% ARPU increase lifts estimated LTV by 20%. Tracking both shows whether the improvement creates lasting value.
2. ARPU and CAC (customer acquisition cost)
CAC payback estimates how long customer gross profit takes to recover acquisition spending. A simple monthly estimate is CAC ÷ (ARPU × gross margin).
Faster payback gives the business more room to reinvest in growth. However, comparisons should use the same customer segment, period and cost definition.
3. ARPU and churn
Losing high-ARPU customers and replacing them with lower-value users can reduce ARPU even when the total user count remains stable.
Tracking ARPU by cohort and segment reveals changes in customer quality earlier. It also shows whether churn is concentrated among valuable users.
4. ARPU and ARPPU (average revenue per paying user)
ARPPU excludes free users and measures revenue from paying subscribers only. It gives freemium businesses a clearer view of paid-user monetisation.
Tracking ARPU and ARPPU together separates conversion performance from spending behaviour among customers who already pay.
How Accounting and Revenue Tracking Software Supports ARPU Analysis
ARPU depends on accurate revenue and user data. Disconnected billing, accounting, CRM and analytics tools can produce delayed results, inconsistent definitions or missing revenue.
Accurate tracking requires recurring revenue linked to user or account records. Reliable financial reporting also depends on aligned periods and segmentation by plan, cohort and acquisition date.
HashMicro’s accounting software connects invoicing, revenue and reporting in one environment. This reduces manual work when calculating and comparing ARPU across periods.
With connected ARPU data, finance and product teams can detect trends earlier, adjust pricing faster and model potential changes before implementation.
Conclusion
ARPU measures monetisation efficiency, not only revenue volume. Consistent tracking by period and segment, alongside CAC and LTV, shows whether pricing and packaging are working.
Businesses seeking connected revenue, user and subscription data can arrange a free consultation to explore a more consistent reporting environment.
Turn Revenue Data Into Clearer ARPU Decisions
See how HashMicro connects invoicing, revenue, and financial reporting to support consistent ARPU analysis and faster monetisation decisions.
Frequently Asked Questions About ARPU
Subscription businesses usually review ARPU monthly, then compare quarterly and annual trends. Keep the revenue, user and period definitions unchanged across each review.
Use net revenue after refunds, credits and discounts when those amounts reduce recognised revenue. Document the rule and apply it consistently across reporting periods."]
Yes. ARPU can rise if low-value users leave faster than revenue declines. Review user count, churn and segment-level revenue before treating the increase as healthy.
Use average active users when the customer base changes significantly during the period. End-of-period users may suit a snapshot, but the chosen method must remain consistent