






Warehouse dashboards can display dozens of figures yet still leave managers unsure where to act. Activity counts matter, but they become useful only when tied to a clear decision and owner.
Effective warehouse KPIs connect each result to a target, review schedule and required response. This structure helps managers detect change, investigate its cause and assign corrective action quickly.
A balanced framework protects service and safety while improving speed, cost and capacity. Faster picking creates little value when errors, returns, congestion or workplace risks rise with it.
Key Takeaways
Warehouse KPIs measure receiving, storage, inventory, picking, fulfilment and returns, each linked to a target, owner and required response.
Choosing the right warehouse KPIs starts with management decisions and selects measures that fit the facility workflow and service model.
Essential warehouse KPIs and formulas cover 20 measures across receiving, inventory, picking, fulfilment, cost, labour, equipment and safety.
Building a warehouse KPI dashboard requires a KPI dictionary, consistent data sources, exception-led reporting and controlled formula changes.

What Are Warehouse KPIs?
Warehouse KPIs measure receiving, storage, inventory, picking, fulfilment and returns. They turn day-to-day warehouse control into results that can be tested against defined operational and service objectives.
Each KPI should answer a specific management question and identify the formula, scope, data source, target, owner and review frequency. It should also define when action becomes necessary.
Warehouse metrics describe activity, while warehouse performance metrics become KPIs when linked to an objective and response. This distinction keeps dashboards focused on decisions rather than volume.
"A warehouse metric only becomes a KPI once it carries a target, an owner and a defined response, not simply an activity count."
Leading vs Lagging Warehouse KPIs
Leading KPIs highlight conditions that may shape future warehouse performance, while lagging KPIs confirm completed results. Managers should use both to act early and verify whether improvements worked.
| KPI Type | What It Measures | Warehouse Examples | Management Use |
|---|---|---|---|
| Leading KPIs | Activities and operating conditions that may influence future results | Receiving backlog, replenishment response time, labour coverage and preventive maintenance completion | Identify risks early and adjust staffing, priorities or workflows before performance declines |
| Lagging KPIs | Completed outcomes that show how the warehouse has already performed | Order accuracy, order cycle time, cost per order, shrinkage and customer returns | Evaluate results, confirm whether changes worked and support longer-term planning |
How to Choose the Right Warehouse KPIs
Start with the operational decisions managers must make, then select measures that reveal whether those decisions improve results. The best set reflects the facility's products, workflow and service model.
A high-SKU ecommerce site needs different warehouse manager KPIs from a pallet-based industrial facility. Order complexity, automation, storage rules and demand patterns must shape the final selection.
1. Core, Diagnostic and Context Metrics
A core KPI shows whether a priority outcome was achieved, while a diagnostic metric explains why it changed. A context metric describes workload, complexity or conditions affecting fair comparison.
Inventory accuracy may be a core KPI, unconfirmed transfers a diagnostic metric and average lines per order a context metric. Together, they connect performance outcomes with credible causes.
2. Warehouse-Controlled vs Shared KPIs
Warehouse teams directly control measures such as putaway and picking accuracy, but they only influence outcomes such as OTIF and inventory turnover. Ownership must reflect that operational boundary.
Shared warehouse operations KPIs need joint accountability across Sales, Planning, Procurement, Finance and Transport. Clear ownership prevents warehouse staff carrying blame for upstream or external failures.
Essential Warehouse KPIs and Formulas
Every warehouse KPI needs a documented unit, denominator, timestamp, exclusion rule and reporting period. Define whether output is counted by order, line, unit, case, pallet, task or labour hour.
Formulas create consistency only when teams apply the same scope to every period and facility. Segment results where product type, handling rules, shift patterns or service commitments differ materially.
1. Dock-to-Stock Time
Dock-to-stock time measures how long received goods take to become available for storage, picking, production or sale. Calculate the stock-available timestamp minus the agreed goods-arrival timestamp.
Define whether timing starts at vehicle arrival, unloading or receipt confirmation. Separate standard receipts from inspection or quarantine flows so delays reveal congestion, capacity gaps or backlogs.
2. Receiving Accuracy
Receiving accuracy shows whether verified inbound lines match the expected product, quantity, unit, condition and tracking details. Calculate accurate verified receipt lines divided by all verified receipt lines.
Classify wrong SKUs, quantities, units, damage, lot numbers and serial numbers separately. Distinguish supplier discrepancies from internal errors so Procurement and Warehouse teams act correctly.
3. Putaway Cycle Time
Putaway cycle time measures the average time required to place received goods in confirmed storage locations. Scan-based movement records help verify completion before total putaway time is divided by completed putaway tasks.
State whether timing starts when a task is released or accepted, and ends after location confirmation. Segment by zone, shift, equipment and product type to expose travel, capacity or priority issues.
4. Putaway Accuracy
Putaway accuracy measures whether staff place the correct product, quantity and stock identity in the approved location. Divide correctly verified putaway tasks by all verified putaway tasks, then multiply by 100.
Checks should cover warehouse, bin, product, quantity, lot, serial number, status and storage conditions. Poor accuracy later appears as stock discrepancies, picking delays and unavailable inventory.
5. Replenishment Completion Rate
Replenishment completion rate shows whether reserve stock reaches pick locations by the required time. Divide replenishment tasks completed on time by all required replenishment tasks, then multiply by 100.
Late replenishment can make productive pickers appear slow because pick faces are empty. Review task release times, source stock, incomplete transfers and repeated shortages before changing labour targets.
6. Inventory Accuracy
Inventory accuracy shows whether verified physical stock matches the warehouse record. Divide count lines without confirmed variance by all verified count lines, then multiply the result by 100.
Define each line as an SKU, SKU-location pair, lot or serial identity before comparing results. Report quantity-weighted accuracy separately so large discrepancies are not hidden by many small matches.
7. Inventory Shrinkage
Inventory shrinkage measures confirmed stock loss rather than every temporary mismatch. Divide confirmed inventory loss value by recorded inventory value, then multiply the result by 100.
First rule out timing gaps, unposted transfers, wrong locations, counting mistakes and unit issues. Use reason codes for theft, damage, expiry and unexplained loss to direct corrective controls.
8. Warehouse Space Utilisation
Warehouse space utilisation measures occupied usable storage cube against total usable storage cube. Divide occupied usable cube by total usable cube, then multiply the result by 100.
Exclude offices, safety clearances, restricted staging zones and unusable areas consistently. Pair utilisation with cycle time, congestion and safety because maximum density can weaken warehouse performance.
9. Picking Productivity
Picking productivity measures completed picking output against direct labour input. Divide completed picked order lines by direct picking hours, while reporting units, cases or pallets separately.
Define whether breaks, meetings, waiting and indirect work count as labour time. Segment by shift, zone, method and order profile before using this measure for staffing, coaching or process changes.
10. Picking Accuracy
Picking accuracy measures whether completed lines contain the correct SKU, quantity and traceable stock identity. Divide accurate picked lines by all completed picked lines, then multiply by 100.
Classify wrong products, quantities, lots, serials, substitutions and handling damage. Packing corrections often reveal errors earlier than returns, which may arise from transport or customer decisions.
11. Pick-and-Pack Cycle Time
Pick-and-pack cycle time measures internal processing from warehouse order release to packing completion. Calculate packing-completion time minus the confirmed warehouse order-release time.
Break the result into queue, active picking, replenishment waiting, packing and exception time. This detail shows whether delays come from labour, stock availability, workflow design or unresolved orders.
12. On-Time Dispatch Rate
On-time dispatch rate shows whether orders leave the warehouse by the confirmed deadline. Divide orders dispatched on time by all orders due for dispatch, then multiply the result by 100.
Document how the KPI treats customer holds, credit blocks, cancellations, date changes and carrier cut-offs. Within the broader customer fulfilment process, this measure isolates warehouse execution more clearly than final delivery performance.
13. Perfect-Order Rate
Perfect-order rate measures orders completed without service or execution failure. Divide orders delivered complete, accurate, undamaged and correctly documented by all delivered orders, then multiply by 100.
An order qualifies only when it meets every approved condition, not most of them. Define whether correct invoices, labels, references and delivery documents form part of the warehouse management KPI.
14. On-Time In-Full Delivery
On-time in-full delivery, or OTIF, measures whether customers receive complete orders by the confirmed date. Divide orders delivered on time and in full by all delivered orders, then multiply by 100.
Define the promised date, partial-order treatment, approved changes and customer-caused delays. Review OTIF with fill rate and on-time dispatch to separate warehouse, planning and transport failures.
15. Return-Processing Time
Return-processing time measures how long returned goods remain unresolved after receipt. Calculate final-disposition time minus return-receipt time for each completed return, then report the agreed average.
Final disposition may include restocking, repair, quarantine, disposal or return to a supplier. Segment results by condition and outcome because each pathway requires different checks, approvals and handling.
16. Warehouse-Attributable Return Rate
Warehouse-attributable return rate isolates returns caused by picking, packing or handling errors. Divide warehouse-caused returned items or orders by total shipped items or orders, then multiply by 100.
Use controlled reason codes for wrong products, quantities, packing failures and warehouse damage. Separate product quality, customer preference and transport damage so the team addresses valid causes.
17. Cost per Fulfilled Order
Cost per fulfilled order measures the defined warehouse cost required to complete outbound demand. Divide approved fulfilment costs by fulfilled orders, using the same cost scope in every reporting period.
Document labour, packaging, equipment, software, utilities, occupancy, rework and overhead inclusions. Add cost per line when order complexity varies, since one order may contain far more work than another.
18. Labour Utilisation
Labour utilisation measures productive direct hours against available scheduled hours. Divide productive direct hours by available scheduled hours, then multiply the result by 100.
High utilisation can increase fatigue, overtime, errors and deferred maintenance when treated as a goal alone. Pair it with throughput, accuracy and safety measures before changing rosters or workload.
19. Equipment Downtime
Equipment downtime measures when required warehouse equipment is unavailable during scheduled operation. Divide unavailable equipment time by scheduled equipment time, then multiply the result by 100.
Separate planned maintenance, breakdowns, charging, parts delays, safety lockouts and operator shortages. Cause-based records help managers choose maintenance, procurement, scheduling or training actions.
20. Warehouse Safety Metrics
Warehouse safety metrics should follow applicable Australian work health and safety definitions. A frequency rate divides qualifying occurrences by hours worked, then multiplies the result by 1,000,000.
Australian frequency reporting differs from the United States basis of 200,000 hours. Track near misses, inspections, corrective-action closure and training completion alongside injury outcomes.
Daily, Weekly and Monthly Warehouse KPI Reviews
| Review Cadence | Primary Focus | Typical Management Decision |
|---|---|---|
| Daily | Receiving backlogs, replenishment delays, picking output, accuracy, dispatch deadlines and urgent safety exceptions | Reallocate labour, reprioritise tasks and clear immediate bottlenecks |
| Weekly | Dock-to-stock time, order cycle time, overtime, equipment downtime, returns and inventory discrepancies | Adjust workflows, training, maintenance plans and staff schedules |
| Monthly | Cost per order, inventory accuracy trends, shrinkage, space utilisation and shared service outcomes | Make capacity, budget, layout and investment decisions |
Daily reviews should focus on receiving backlogs, replenishment delays, picking output, accuracy, dispatch deadlines and urgent safety exceptions. Supervisors can then reallocate labour and clear bottlenecks.
Weekly reviews should examine dock-to-stock time, order cycle time, overtime, equipment downtime, returns and inventory discrepancies. Managers can use these trends to adjust training, maintenance and schedules.
Monthly reviews should assess cost per order, inventory accuracy trends, shrinkage, space utilisation and shared service outcomes. Leaders can then make informed capacity, budget, layout and investment decisions.
How to Set Warehouse KPI Targets and Benchmarks
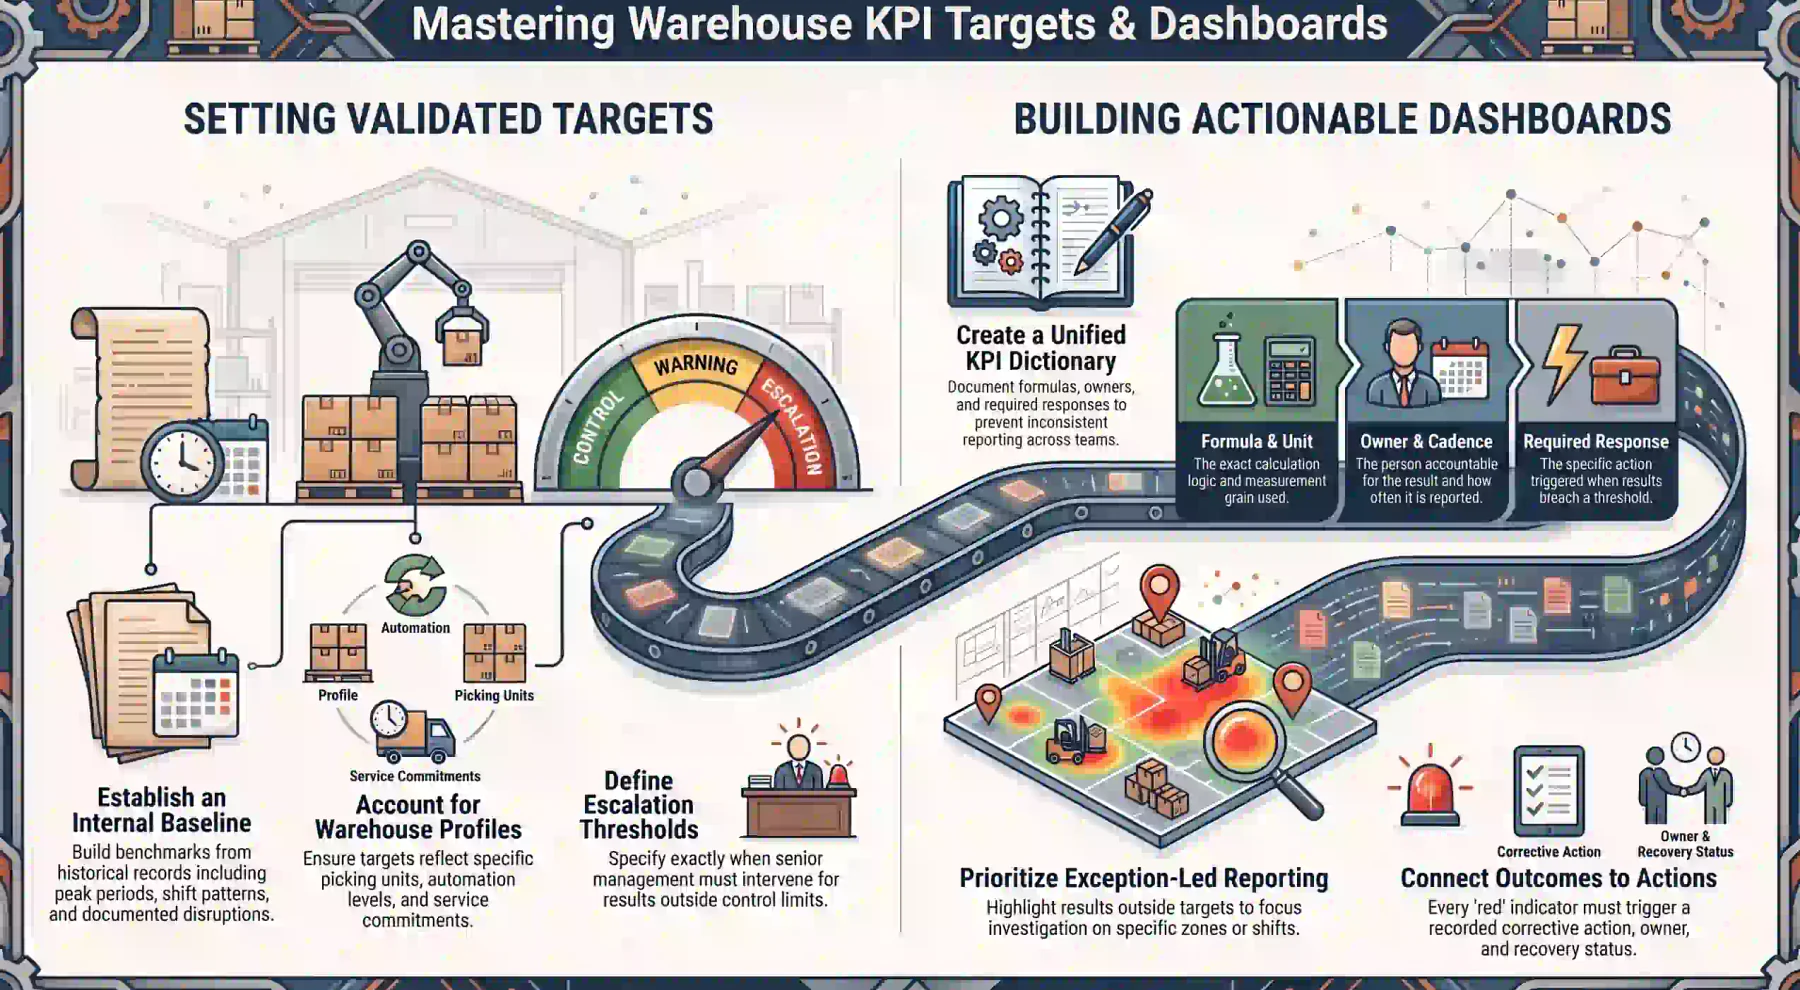
Targets should convert warehouse management KPIs into decision thresholds without hiding normal variation. A structured measurement framework should use internal evidence first, with ASCM's warehouse KPI guidance as external context.
1. Establish an Internal Baseline
Build the baseline from reliable historical records measured under one approved definition. Include normal and peak periods, shift patterns, product mix, service commitments and documented disruptions.
Do not remove weak periods merely because they reduce the average. Apply approved exclusion rules consistently and preserve excluded events so managers can understand recurring risk and operational volatility.
2. Account for Different Warehouse Profiles
Warehouse profiles differ by picking unit, automation, SKU range, product dimensions, storage conditions and service level. These factors change the labour, travel, equipment and control effort behind each result.
A piece-picking ecommerce facility should not inherit a full-pallet warehouse's productivity target. Compare similar workflows first, then use improvement against each site's baseline for broader reporting.
3. Set Targets, Control Limits and Escalation Thresholds
A target defines the intended result, while a control limit identifies unusual variation that requires investigation. An escalation threshold specifies when senior management or another function must intervene.
Set a separate stretch objective only after approving the process change expected to deliver it. Record every threshold, owner and review date so poor performance cannot be disguised through informal revisions.
How to Build a Warehouse KPI Dashboard
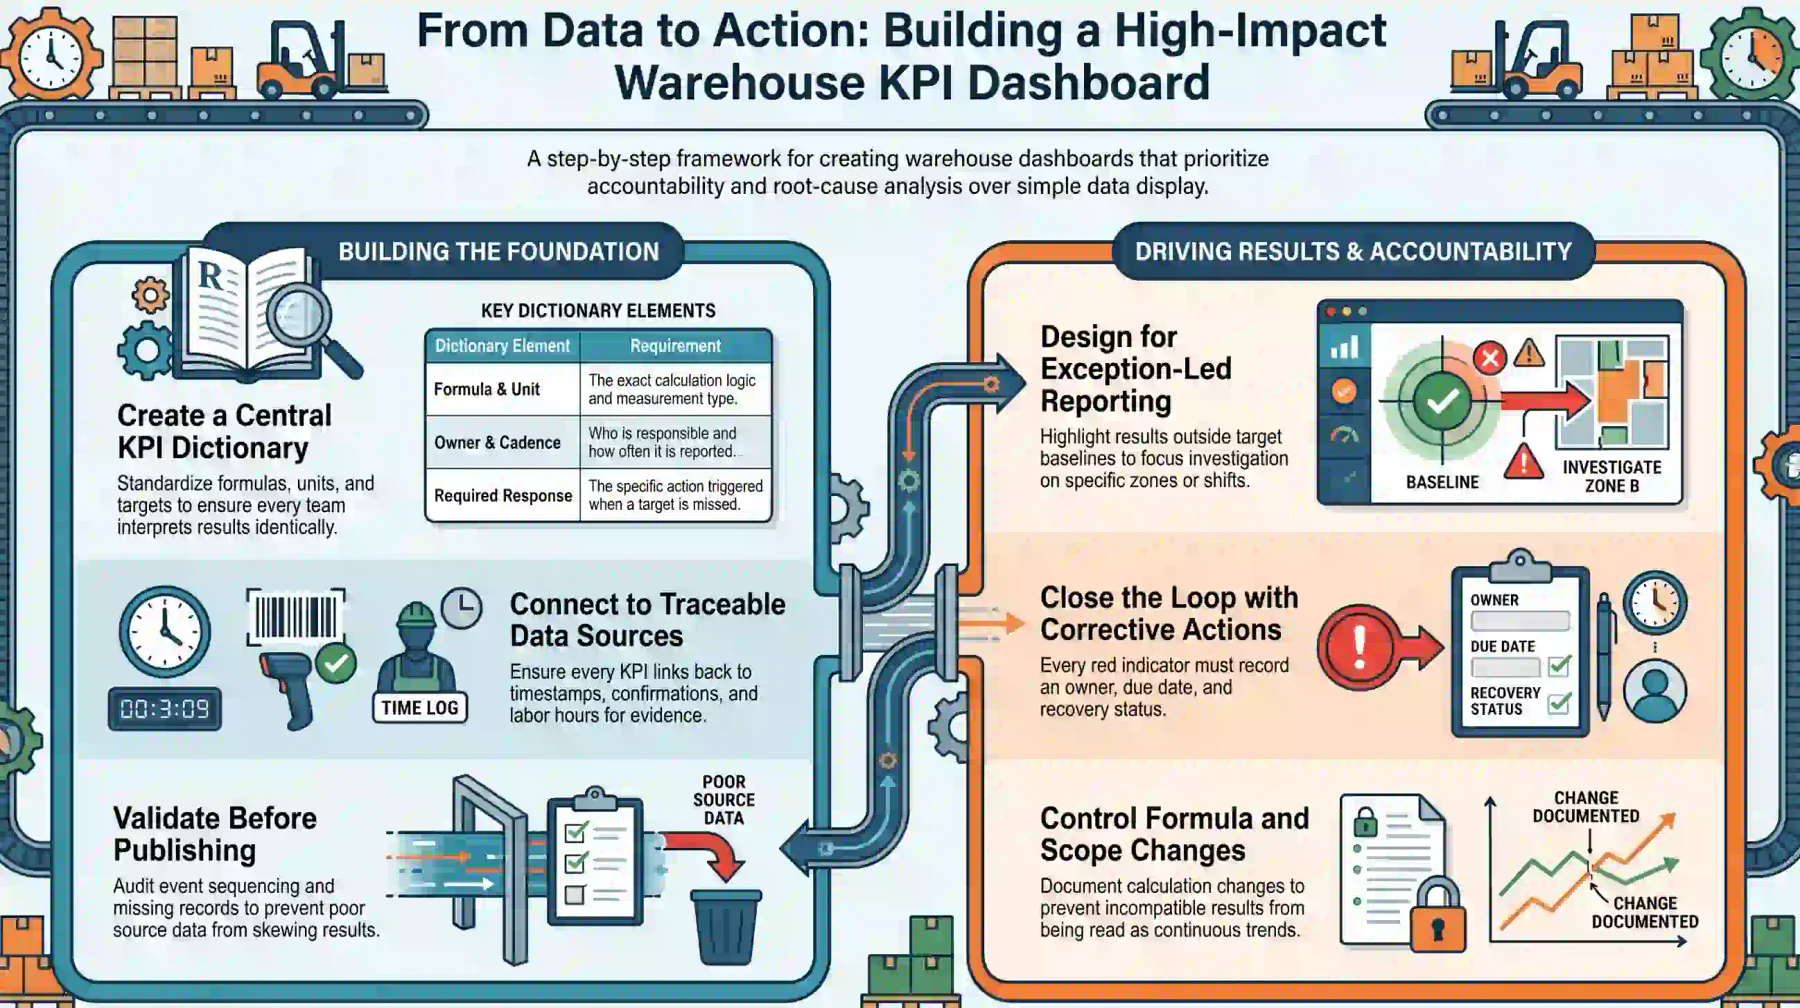
A warehouse KPI dashboard should lead users from an outcome to its causes and supporting transactions. Prioritise exceptions, trends and accountable actions instead of displaying equal-weight figures.
1. Create a Warehouse KPI Dictionary
A KPI dictionary gives every warehouse one approved definition for each measure. Record its purpose, formula, unit, grain, source, exclusions, owner, cadence, target, limits and required response.
Maintain a dated definition history whenever calculation logic or reporting scope changes. This control prevents teams from using the same KPI name for results that cannot be compared reliably.
2. Use Consistent Data Sources
Each KPI should connect to the operational records that created it, including timestamps, confirmations, stock movements, labour hours and exceptions. Managers must be able to trace results to evidence.
Automated extraction reduces manual consolidation risk, but it does not correct poor source data. Validate event sequencing, user access, missing records and duplicate transactions before publishing results.
3. Design Exception-Led Reporting
Exception-led reporting highlights results outside a target, limit or baseline and supports focused investigation. Users should be able to filter by warehouse, zone, SKU, shift, employee or transaction type.
After locating the cause, the dashboard should record the corrective action, owner, due date and recovery status. A red indicator without this workflow reports failure but does not help managers resolve it.
4. Control Formula and Scope Changes
Changes to formulas, source systems, exclusions or reporting grain must be approved and documented. Mark the effective date clearly so users do not interpret incompatible results as one continuous trend.
If picking productivity changes from orders per hour to lines per hour, recalculate reliable history or split the series. Preserve the previous definition so audits and management reviews retain context.
How a Warehouse Management System Supports KPI Measurement
A warehouse management platform captures the tasks and transactions needed to calculate reliable KPIs. Relevant records include receipts, locations, movements, replenishment, picks, packs, dispatches and returns.
Lot and serial histories, user activity, timestamps, adjustments and exceptions provide diagnostic evidence. Connected records allow managers to move from a warehouse performance result to its underlying event.
Warehouse Management Software connects these operational records across warehouse workflows. The system supports consistent reporting, while managers still define each KPI's formula, target and response.
Once warehouse records are connected, automated warehouse workflows can help managers move from monitoring to action. Hashy AI flags KPI exceptions, reveals contributing events and identifies the responsible owner and next step.






Conclusion
Effective warehouse KPIs connect outcomes with decisions, owners and corrective action. They become more useful when core results are supported by diagnostic metrics that reveal the cause of change.
Managers should improve speed and cost without sacrificing accuracy or safety. A connected WMS preserves the tasks and timestamps that show what changed and what action should follow.
If you are interested in learning further about warehouse KPIs, then you can book a free consultation with our experts today. Implement your own KPIs and grow your business.

FAQ
The most important warehouse KPIs cover receiving, inventory, picking, dispatch, cost, space and safety, chosen to match current objectives, complexity and risk, with diagnostic measures that reveal the cause of change.
A warehouse metric records an activity, such as completed order lines, while a KPI ties that metric to an objective, target, owner and required response, directing decisions rather than just describing volume.
Warehouse performance is measured with balanced indicators across speed, accuracy, service, cost, inventory, capacity, labour and equipment, combining outcome KPIs with diagnostic measures for credible comparisons.
Warehouse KPI targets should start from a verified internal baseline, adjusted for product mix, complexity and service levels, using external benchmarks as context and control limits to flag unusual variation.
Review urgent measures like backlogs, picking and dispatch by shift or day, assess process trends weekly, and review cost, capacity and strategic outcomes monthly, matching cadence to the decision required.