




Food costs can rise even when revenue stays flat. The gap between what a kitchen buys and what it sells can come from spoiled ingredients, preparation losses, or uneaten food. Without tracking these losses, Philippine food businesses may struggle to see where costs are leaking.
Food waste is also a significant issue beyond individual kitchens. The UN Environment Programme reports that an estimated 1.05 billion tonnes of food waste were generated globally in 2022 across households, food service, and retail. This highlights why measuring and managing food waste matters for businesses looking to control operating costs.
This guide explains what food waste management means, the common causes of food waste, how to calculate food waste percentage, and practical ways to reduce it. It also covers food waste segregation and how technology can support better waste and inventory tracking.
Key Takeaways
Food waste management helps businesses track, understand, and reduce food waste through better purchasing, preparation, storage, and service.
The four main causes of food waste in Philippine restaurants can be identified through early warning signs, helping businesses take the right action before waste increases.
The five steps below provide a structured approach to reducing food waste, starting with an audit to establish a clear baseline before making operational changes.
What Is Food Waste Management?
Food waste management is the process of tracking ingredients and prepared food that leave a kitchen without generating revenue. It helps businesses understand why waste happens and reduce it through better purchasing, preparation, storage, and service.
For Philippine food businesses, food waste management is also a cost control practice. It helps separate issues such as spoilage, preparation waste, and uneaten food so businesses can identify where losses occur and take the right action.
Food Waste vs. Food Loss vs. Inventory Shrinkage
These three terms often appear in the same conversation, but they describe losses at different points and require different fixes. Mixing them up is why many kitchen reports look accurate on paper yet fail to explain where the money actually went.
| Term | Where It Happens | Typical Causes | Who Manages It |
|---|---|---|---|
| Food Waste | Kitchen or table stage, after food reaches the outlet | Spoiled produce, overcooked batches, returned plates, over-portioning | Kitchen and outlet managers |
| Food Loss | Earlier in the supply chain, before food reaches the kitchen | Farm damage, transport spoilage, cold chain failure, distribution delays | Suppliers and logistics partners |
| Inventory Shrinkage | Anywhere stock is recorded, across storage and transfers | Theft, administrative error, unrecorded transfers, miscounted receiving | Inventory and finance teams |
This article focuses on food waste at the kitchen level. Inventory shrinkage is a related but separate problem with its own tracking approach, since it covers all unexplained stock reduction rather than organic spoilage alone. Conflating the two produces reports where no category is accurate.
Avoidable vs. Unavoidable Waste
Not all waste is preventable. Separating necessary waste from losses caused by ordering, storage, prep, or portioning helps kitchens identify what they can actually reduce.
| Category | What It Covers | Examples | Can It Be Reduced |
|---|---|---|---|
| Unavoidable Waste | Material that cannot be served even with perfect handling | Bones, shells, citrus peels, coffee grounds, fish trimmings | No, but it can be measured and sometimes repurposed into stock or byproducts |
| Avoidable Waste | Material that was once sellable but was lost to a process failure | Over-preparation, spoilage from poor storage, oversized portions returned on plates, expired stock | Yes, through better forecasting, storage control, portion standards, and recipe costing |
Setting a realistic waste reduction target starts with separating the two categories. A single waste figure cannot show whether losses came from over-preparation or ingredients with naturally higher trim.
Why Food Waste Is a Cost Problem, Not Just a Sustainability Issue

A kilogram of discarded chicken does not just represent a failed meal. It represents the purchasing cost, the cold storage cost, and the labor cost of the staff who handled it, none of which produced any revenue.
How Waste Inflates Food Cost Percentage
Food cost percentage measures the proportion of revenue consumed by ingredient costs. When waste is high, effective food cost rises even if purchase prices stay flat, because the same spend produces fewer sellable portions. A kitchen running 32% food cost on paper may be running closer to 38% in practice once waste is counted against revenue-generating output.
The gap between paper food cost and actual food cost is exactly the number food waste management is designed to produce and then close.
Waste and Contribution Margin per Menu Item
Items with inconsistent yield or high prep waste carry a lower real contribution margin than their recipe cost suggests. In a menu engineering matrix, those items often land in the Plowhorse or Dog quadrant not because the recipe is wrong but because the yield assumption is. Measuring waste per item connects the prep floor to the margin report.
The Four Main Causes of Food Waste in Philippine Restaurants
The table below maps each cause to its early indicator and the action it requires. Treating all waste as one category delays the correct response.
| Cause | Kitchen example | Early indicator | First action |
|---|---|---|---|
| Spoilage | Produce rots before use | Stock older than par life found in chiller | Audit rotation and par levels |
| Over-preparation | Extra rice or soup discarded after service | End-of-shift disposal logs show consistent surplus | Tie prep volume to sales forecast, not to habit |
| Trim waste | Inconsistent vegetable yield per kilo | Recipe yield assumptions do not match actual output | Standardize yield per ingredient and train accordingly |
| Plate waste | Portions returned partially eaten | High plate return rate during service review | Review portion sizes against guest feedback |
Spoilage from Weak Stock Rotation and Cold Chain Gaps
Spoilage accelerates in the Philippine climate. A FEFO inventory management discipline, where the stock that expires first is always used first, reduces spoilage without requiring new equipment. Intermittent power outages in some areas compound the problem and make a temperature log on the chiller a practical necessity rather than an audit formality.
Over-Preparation and Inaccurate Demand Forecasting
Preparing more food than the day's demand requires is the most common avoidable cause of kitchen waste. The underlying problem is usually that prep decisions are based on yesterday's service or on a head chef's estimate. A kitchen that sells an average of 40 portions of a dish on Tuesday evenings and preps 60 has a structural problem that daily disposal logs will reveal clearly.
Trim Waste and Inconsistent Yield per Ingredient
If the recipe cost sheet assumes 80% yield on a vegetable but the actual kitchen yield is 65%, every batch produces more waste than the cost model allows. The gap accumulates invisibly until food cost rises and no single cause appears obvious. Standardizing and periodically checking yield rates per ingredient is the correction, not changing the recipe.
Plate Waste from Oversized Portions
Food that returns from the table partially eaten represents a different management challenge. The waste happened after cooking, which means the preparation cost and the service cost were both absorbed with no corresponding revenue gain. Tracking plate return rates and surveying portion satisfaction together identifies whether portion size, presentation, or expectations are the driver.
How to Measure Food Waste: Formula and Worked Example
Measuring waste requires two inputs: the cost of food discarded and the total food purchases against which to measure it.
The Food Waste Percentage Formula
Food waste percentage = (cost of wasted food ÷ total food purchases) × 100
This formula produces a single number that can be tracked weekly, compared across outlets, and benchmarked against industry guidance once a baseline exists. It requires a daily waste log to be in place, so the cost of wasted food is recorded at the time of disposal, not reconstructed from memory.
A Worked Example Using Illustrative Peso Figures
A small restaurant records the following in one week:
Food waste percentage = (9,000 ÷ 85,000) × 100 = 10.6%
For a kitchen spending PHP 85,000 per week on food, that is approximately PHP 9,000 per week leaving the kitchen without producing revenue. Over a year, the same rate is roughly PHP 468,000. The number alone does not tell the kitchen what to change, but it gives management a figure to act on and a baseline to measure improvement against.
What to Log in a Daily Waste Sheet
A waste log does not need to be complex to be useful. The minimum columns are: date, item name, quantity, unit, reason for disposal, estimated cost, shift, and branch. Reason codes (spoilage, over-prep, trim, plate return) enable the categorization that makes the data useful. A log without reason codes produces a cost total but no diagnosis.
How to Reduce Food Waste in Your Food Business: A Step-by-Step Guide
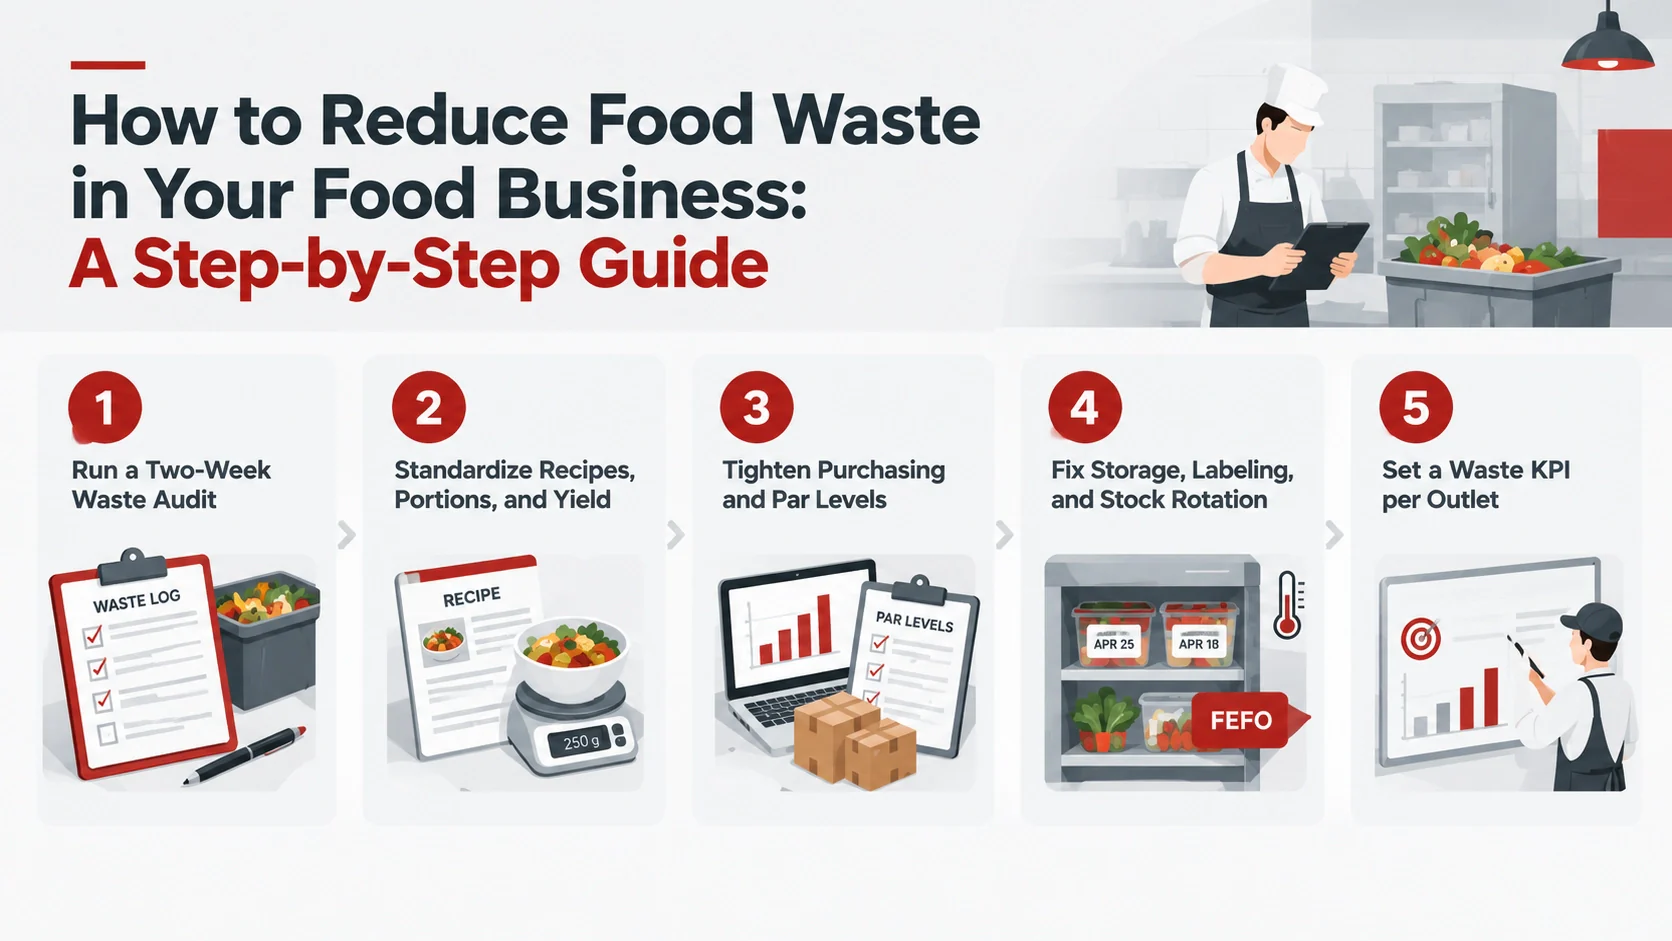
These five steps are ordered deliberately. Skipping to a system or a training program before completing the audit step produces changes that cannot be measured against a baseline.
Step 1: Run a Two-Week Waste Audit Before Changing Anything
Before changing any process, spend two weeks recording every disposal in the waste log format described above. The purpose is not to catch staff out but to establish what is actually happening. Most kitchens discover that one or two categories account for the majority of the cost, which focuses the subsequent steps.
Step 2: Standardize Recipes, Portions, and Yield per Ingredient
Once the audit identifies the categories contributing most, standardize the inputs. Confirm actual yield rates per ingredient, update the recipe cost sheets to match, and set a standard portion weight where plate waste is a factor. Standardization eliminates the variance that makes waste hard to attribute.
Step 3: Tighten Purchasing and Par Levels Against Actual Sales
Par levels set from habit instead of data create structural over-purchasing. Pull four weeks of sales data per day of the week, calculate the average consumption rate per ingredient, and set par levels with a safety margin that reflects actual supply lead times rather than worst-case anxiety. Review par levels monthly rather than annually.
Step 4: Fix Storage, Labeling, and Stock Rotation
Label every item in cold storage with its delivery date and use-by date. Apply FEFO: the item that expires first goes to the front of the shelf and is used first. This single practice is the most effective single intervention against spoilage in a Philippine kitchen, where stock rotation is frequently disrupted by delivery timing and staff turnover.
Step 5: Set a Waste KPI per Outlet and Review It Weekly
A target without a review cadence is an aspiration. Set a weekly waste percentage target per outlet, review it in the weekly briefing, and track it on a visible board in the kitchen. The review does not need to be formal, but it needs to happen consistently. When waste rises above the target, the reason codes from the daily log identify whether the cause is a storage issue, a prep issue, or a demand forecasting issue.
Food Waste Regulations for Food Establishments in the Philippines
Philippine food establishments face waste-related legal obligations that global food waste guides do not cover. This section addresses the regulations specifically.
RA 9003 Ecological Solid Waste Management Act and Mandatory Segregation
Republic Act 9003, the Ecological Solid Waste Management Act of 2000, requires waste segregation at source, including commercial establishments such as food businesses. Section 22 also requires separate, properly marked containers for compostable, non-recyclable, recyclable, and special waste. Food waste should be placed in the compostable stream rather than mixed with other waste.
Section 48 prohibits the collection of non-segregated or unsorted waste, while Section 49 sets penalties of ₱1,000 to ₱3,000, imprisonment of 15 days to six months, or both for violations. For food businesses, maintaining a waste log can also support compliance by documenting the type of waste generated, collection or composting activities, and the person responsible for disposal.
LGU Ordinances and What Inspectors Usually Ask For
The national framework under RA 9003 sets minimum standards, but the technical requirements for collection frequency, approved disposal methods, and composting obligations vary by city or municipality. A restaurant operating in Quezon City is subject to different LGU ordinances than one in Davao. Before assuming that national segregation compliance is sufficient, check the relevant city ordinance, since LGU requirements sometimes exceed the national minimum.
In practice, LGU inspectors at health and sanitation inspections typically look for three things: visible segregated waste bins at the correct locations, a record of collection or disposal for organic waste, and no organic waste mixed into non-biodegradable containers.
Food Donation and Diversion Options
Not all unsold food must be disposed of as waste. Philippine food rescue organizations accept surplus prepared food, and some LGUs have registered composting partners that accept organic kitchen waste. Excess raw ingredients still within safe storage life can be redirected to staff meals, reducing waste cost and providing a staff benefit simultaneously.
Pig feed arrangements with registered buyers are an option in some areas for specific waste categories. None of these constitute legal advice, the applicable rules vary by product type, food handling requirements, and LGU.
Using a Food Waste Management System to Track Waste Automatically
A manual waste log is a workable starting point. It becomes a bottleneck at two or more outlets, where entries are inconsistent, reason codes drift, and the weekly consolidation takes longer than the review it is meant to support.
What a Waste Tracking Feature Should Record
A system that handles waste tracking should record disposal events against the specific SKU or recipe ingredient, not just a free-text description. It should support reason codes, capture the staff member and shift responsible, and produce a cost figure automatically by pulling the ingredient cost from the purchase record rather than requiring a manual valuation. That cost linkage is what connects the waste log to the financial report.
Connecting Waste Data to Recipe Costing and Inventory
A standalone waste log is a cost report. A waste log connected to recipe costing and inventory is a management tool. When the system knows that the current purchase cost of fresh chicken thigh is PHP 220 per kilo and the waste log records 4 kilos discarded on Tuesday, the waste cost entry in the financial report is automatic and accurate. Without that connection, the waste log requires someone to manually look up and enter the cost, and that step is frequently skipped.
The same connection applies to inventory. When waste is recorded, the system reduces stock accordingly, so the available quantity at any point reflects actual kitchen stock rather than the theoretical figure based on purchases and sales alone.
Tracking Waste Across Multiple Outlets and a Central Kitchen
Multi-outlet businesses with a central kitchen need to attribute waste to the correct location. A central kitchen supplying five branches should record waste during production and at each outlet, allowing consolidated reports to identify which branch or production run generates excessive waste without manual spreadsheet consolidation.
For how central kitchen operations handle waste in the context of broader production management, see the commissary kitchen management guide.
HashMicro's F&B module handles waste tracking alongside recipe costing and inventory, so the cost of a disposal event is reflected in the inventory record and the food cost report without a separate entry.

Conclusion
Food waste becomes manageable when it is measured consistently. A daily waste log with reason codes and a weekly review helps kitchens identify where losses occur, while connecting waste records with ingredient costs and inventory provides a clearer view of their financial impact.
For Philippine food businesses, a practical starting point is a two-week waste audit using the log format in this guide. The results can show which waste category needs attention first, while the food waste percentage provides a clear baseline for measuring improvement over time.
For businesses looking to improve waste tracking and inventory visibility, try a free demo and see how food waste management software can connect waste records, ingredient costs, and stock levels in one system.

FAQ about Food Waste Management
Industry references commonly cite a range of 4% to 10% of food purchases as a realistic operational target, with well-managed kitchens below 5%. These figures are general benchmarks, not regulatory standards. The practical target for any business is a meaningful reduction from its own measured baseline, not a benchmark drawn from a different market or operation type.
Food waste is organic material discarded because it spoiled, was over-prepared, was trimmed away, or returned from the table uneaten. Inventory shrinkage covers all unexplained stock reduction, including theft, administrative errors, and unrecorded transfers. Both affect food cost, but they require different controls. Tracking them separately produces more useful information than combining them into a single unexplained loss figure.
Yes. Republic Act 9003 requires all waste generators, including food establishments, to segregate biodegradable waste such as food scraps from recyclable and residual categories at source. The technical requirements for disposal, collection frequency, and composting vary by LGU ordinance. Check the applicable city or municipal ordinance for the specific requirements at your location.
A formal two-week waste audit is most useful when establishing a baseline, when food cost rises without a clear cause, or after a significant change in menu, volume, or supplier. Ongoing waste tracking through a daily log replaces the need for formal audits, provided the log captures reason codes and is reviewed weekly.
Yes. A printed daily waste sheet with columns for item, quantity, reason, cost, and shift is sufficient for a single outlet. The constraint is time: someone has to record each disposal at the time it happens, and someone has to calculate the weekly total and review it. Software removes both steps but is not a prerequisite for starting.