






Menu engineering for restaurants is the practice of analyzing which dishes drive the most profit. You then design the menu to sell more of them. A dish can sell quickly because of a promotion, a large portion, or strong customer awareness. Its ingredient cost can still leave almost no contribution after every sale. Philippine restaurant groups feel this pressure harder, because supplier prices, branch locations, delivery channels, and customer preferences all differ across outlets.
The Philippine Statistics Authority recorded 4.6 percent inflation for food and non-alcoholic beverages in August 2026. That rate lifts recipe costs before any restaurant changes a single price. Yet many owners still guess which dishes to keep, reprice, or promote. This guide explains what menu engineering is, why it matters, and how to run it step by step.
Key Takeaways
Menu engineering evaluates each item by both popularity and contribution margin, not sales volume alone.
A reliable analysis depends on consistent sales periods, recipe costs, waste records, outlet segmentation, and documented assumptions.
Each matrix category should trigger an investigation, an accountable owner, and a monitoring plan rather than an automatic menu change.
Multi-outlet teams need shared data definitions and approval rules while preserving branch-level evidence.
What Is Menu Engineering?
Menu engineering is a method for analyzing which items on your menu sell well and which generate enough contribution margin to justify staying. The goal is simple, it is to understand why certain dishes drive profit, why others drain it, and what to do about it before the pattern becomes a financial problem.
Unlike menu design which focuses on layout, photography, and pricing display, menu engineering connects those decisions to real sales data and food cost. It answers three questions:
- Is this item popular?
- Does it contribute enough after food cost?
- And what operational or commercial reason explains the result?
The Two Core Metrics in Menu Engineering
Popularity tells you what customers choose, while contribution margin tells you how much each sale leaves to cover labour, rent, utilities, commissions, overhead, and profit after variable food cost. They answer different management questions, so one number should not replace the other.
| Metric | Formula | Illustrative result | What it helps decide | Limitation |
|---|---|---|---|---|
| Contribution margin per unit | Selling price − variable food cost | ₱320 − ₱125 = ₱195 | Whether one sale leaves useful peso contribution | Excludes labour, rent, utilities, delivery commission, and other operating costs |
| Total contribution margin | Contribution margin per unit × units sold | ₱195 × 180 = ₱35,100 | Which items create the most contribution in the period | Can favor high-volume items even when the recipe is operationally difficult |
| Contribution-margin percentage | Contribution margin ÷ selling price × 100 | ₱195 ÷ ₱320 = 60.9% | Comparing efficiency of revenue retained after food cost | A high percentage can produce fewer pesos than a lower-percentage, higher-priced item |
| Menu mix percentage | Item units sold ÷ total units sold × 100 | 180 ÷ 1,000 = 18% | Measuring popularity against the menu set | Sensitive to the selected period, channels, stockouts, and promotions |
For example, a ₱180 item with a 70% contribution-margin percentage leaves ₱126 per sale. A ₱420 item with a 48% percentage leaves ₱201 per sale. The first item looks better as a percentage, while the second contributes more pesos per unit. A manager should investigate both the percentage and the total contribution, alongside preparation time, waste, and channel fees.
Food cost is also not automatically the same as total variable cost. Depending on the decision, you may need to analyze packaging, delivery commissions, promotional discounts, payment fees, or other costs that vary with each sale. Keep the definition consistent, document exclusions, and avoid comparing figures built from different assumptions.
For a more accurate margin review, restaurant teams should also understand how to calculate restaurant food cost because ingredient expenses directly affect each item's contribution.
How the Menu Engineering Matrix Classifies Your Items
The menu engineering matrix groups items into four quadrants by comparing popularity with contribution margin. These labels describe evidence but they do not prescribe an automatic menu action.
| Category | Popularity | Contribution margin | What it usually signals |
|---|---|---|---|
| Star | High | High | Strong demand and useful contribution also protect availability and execution |
| Plowhorse | High | Low | Customers want it, but recipe cost, portioning, price, discounting, or waste may weaken contribution |
| Puzzle | Low | High | Economically attractive when sold, but awareness, placement, description, price perception, or fit may limit demand |
| Dog | Low | Low | Weak demand and contribution, although strategic, dietary, seasonal, bundle, or brand reasons may justify review |
The threshold is part of the method. One team may classify popularity against average menu mix percentage, while another may use a percentile, a category average, or a management-defined target. Contribution can be compared with the average contribution margin, a category benchmark, or a minimum peso threshold. Classification also depends on reporting period, outlet, channel, recipe version, and cost date.
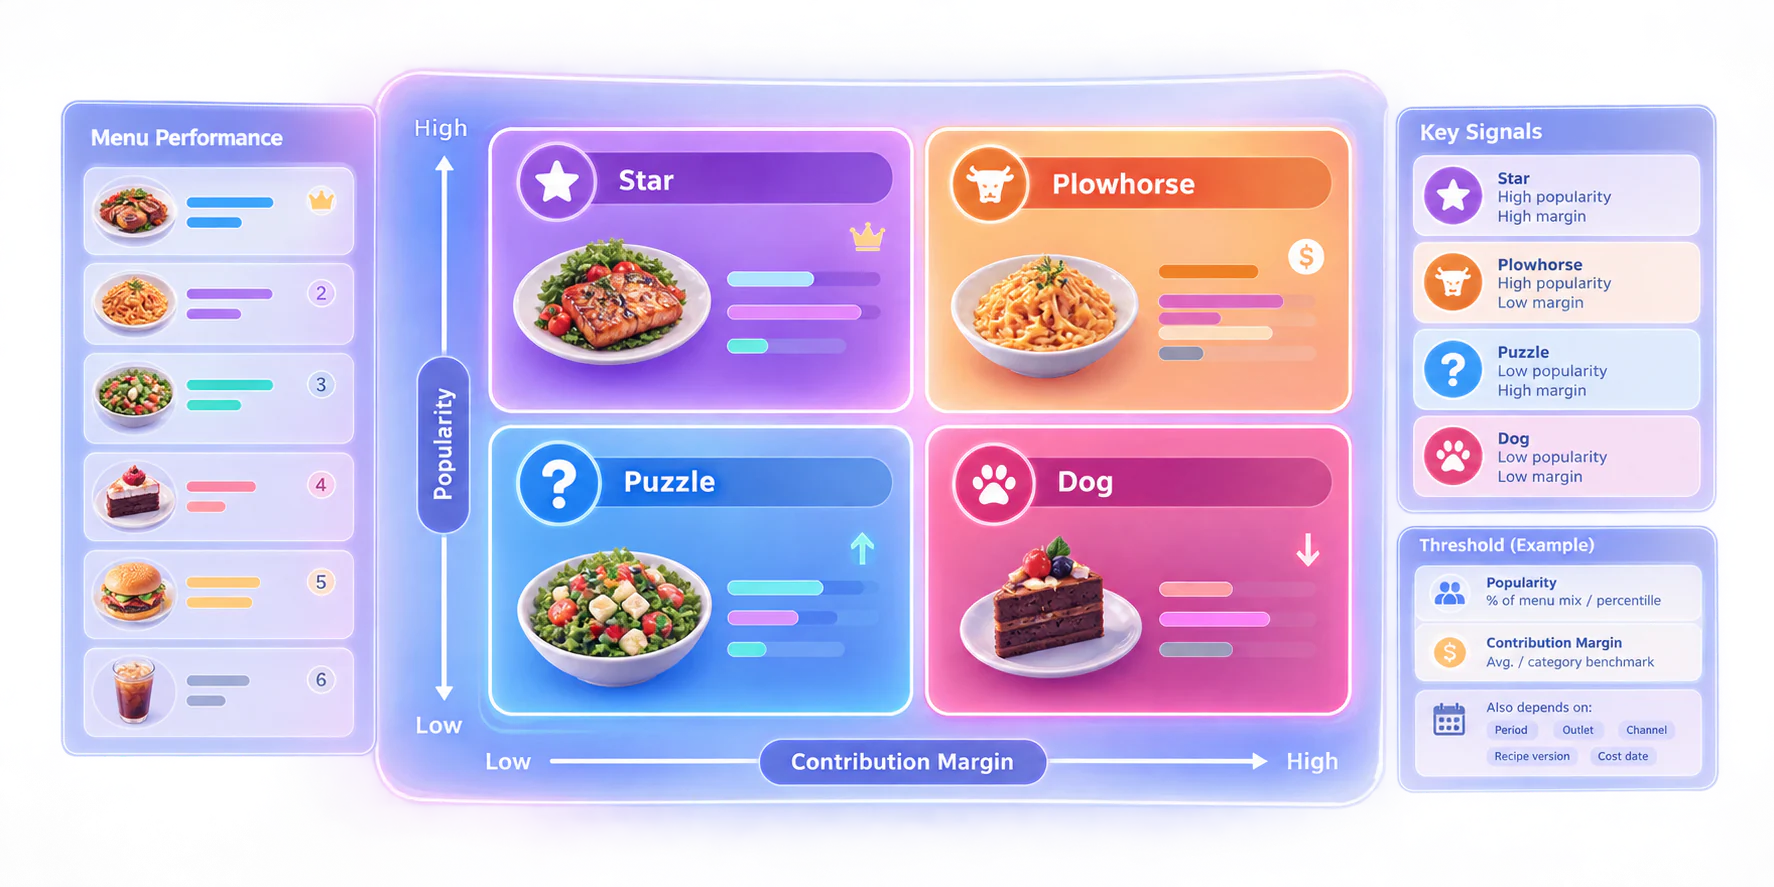
- Stars may be protected but monitored for margin drift
- Plowhorse can creates kitchen pressure despite high sales
- Puzzle may need awareness, not removal
- Dog may serve a necessary role; review in context
Record the interpretation and the owner responsible for the next investigation.
How to Calculate Popularity and Contribution Margin
Start with clean inputs, then calculate each item consistently. The basic contribution-margin formula is:
- Contribution margin per item = selling price - variable food cost per item
Menu mix percentage is:
- Menu mix percentage = item units sold ÷ total units sold × 100
A popularity threshold can be the average menu mix percentage across the items being analyzed. This is only one method. You may instead use a category-specific benchmark or a predefined operating target, provided the method is documented and applied consistently.
| Metric | Formula | Data input | Potential source system |
|---|---|---|---|
| Units sold | Count of completed item quantities | POS transactions, voids, returns | POS or sales system |
| Listed price less approved discount or promotion | Price list, discount records, modifiers | POS and finance records | |
| Variable food cost | Ingredient quantity per recipe × current unit cost | Recipe, purchasing, inventory usage | Recipe, procurement, inventory records |
| Menu mix percentage | Units sold ÷ total units sold × 100 | Item units and menu total | Sales report |
| Contribution margin | Net selling price − variable food cost | Price and cost per item | Costing and finance reports |
| Waste-adjusted review | Cost of discarded or unusable ingredients | Waste logs, stock adjustments | Inventory and operations records |
Before classifying items, validate the following:
- Confirm that the recipe version matches the period being analyzed.
- Refresh ingredient costs after relevant supplier or purchasing changes.
- Separate dine-in, takeaway, delivery, catering, and other channels when fees or prices differ.
- Flag stockouts, closures, unusual events, one-off promotions, and large voids.
- Check modifiers, complimentary items, bundles, and discounts for consistent treatment.
- Segment branches when customer mix, pricing, availability, or execution differs.
- Document the period, thresholds, exclusions, and assumptions in the review file.
Suppose a pasta sells for ₱280 and its variable food cost is ₱110. Its contribution margin is ₱170. If 150 units are sold from a 900-unit menu total, its menu mix is 16.7%. Omitting a discount or using an outdated cheese cost can make the item appear more profitable than it really is. Accurate menu analysis also depends on reliable stock usage and waste records, which are easier to maintain with effective restaurant inventory management.
A Worked Menu Engineering Example
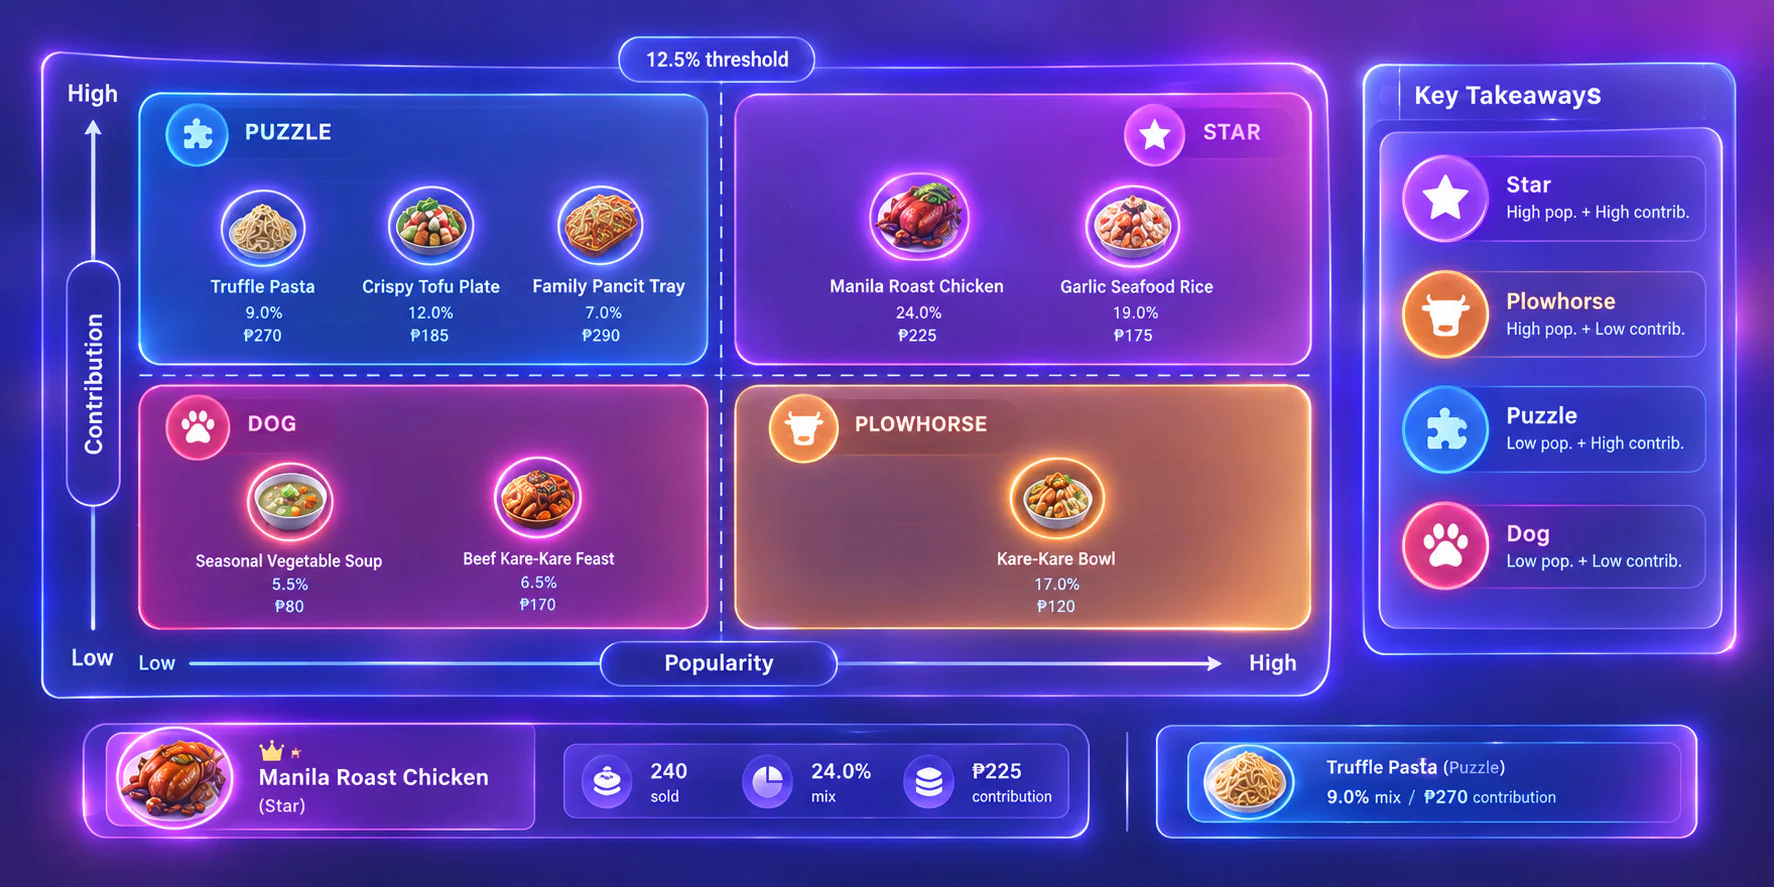
The following menu engineering example is entirely hypothetical. It uses an illustrative four-week reporting period, eight items, and a 12.5% popularity threshold based on the average menu mix percentage across eight items. It does not represent HashMicro or customer data.
| Item | Units sold | Menu mix | Price | Food cost | Contribution per unit | Total contribution | Quadrant |
|---|---|---|---|---|---|---|---|
| Manila Roast Chicken | 240 | 24.0% | ₱360 | ₱135 | ₱225 | ₱54,000 | Star |
| Garlic Seafood Rice | 190 | 19.0% | ₱320 | ₱145 | ₱175 | ₱33,250 | Star |
| Kare-Kare Bowl | 170 | 17.0% | ₱340 | ₱220 | ₱120 | ₱20,400 | Plowhorse |
| Crispy Tofu Plate | 120 | 12.0% | ₱280 | ₱95 | ₱185 | ₱22,200 | Puzzle |
| Truffle Pasta | 90 | 9.0% | ₱420 | ₱150 | ₱270 | ₱24,300 | Puzzle |
| Family Pancit Tray | 70 | 7.0% | ₱650 | ₱360 | ₱290 | ₱20,300 | Puzzle |
| Beef Kare-Kare Feast | 65 | 6.5% | ₱480 | ₱310 | ₱170 | ₱11,050 | Dog |
| Seasonal Vegetable Soup | 55 | 5.5% | ₱220 | ₱140 | ₱80 | ₱4,400 | Dog |
1. The Manila Roast Chicken is a clear Star: it is popular and leaves ₱225 per sale. Kare-Kare Bowl sells strongly but is a Plowhorse because its ₱120 contribution may reflect costly ingredients, oversized portions, waste, or discounting. The first investigation should not be an automatic price increase, but review recipe quantities, purchasing prices, waste, and customer sensitivity.
2. Truffle Pasta looks like a winner based on price and margin per unit, but its low volume makes it a Puzzle. The team should test description, placement, sampling, portion perception, and availability before deciding. Total contribution also matters: although Family Pancit Tray sells fewer units, its large contribution per order creates meaningful period contribution.
The table excludes labour, rent, utilities, delivery commissions, packaging, promotional effects, modifiers, and seasonality. A full profitability review may therefore reach a different conclusion. Treat the classification as a starting point for questions, not a final financial statement.
Once you understand how sales mix and contribution margin shape each menu category, the next challenge is keeping the underlying data accurate and accessible. HashMicro’s restaurant POS system helps centralize sales records, inventory data, and operational reports, giving restaurant teams a clearer foundation for making informed menu decisions and improving profitability.

How to Do Menu Engineering in Five Steps
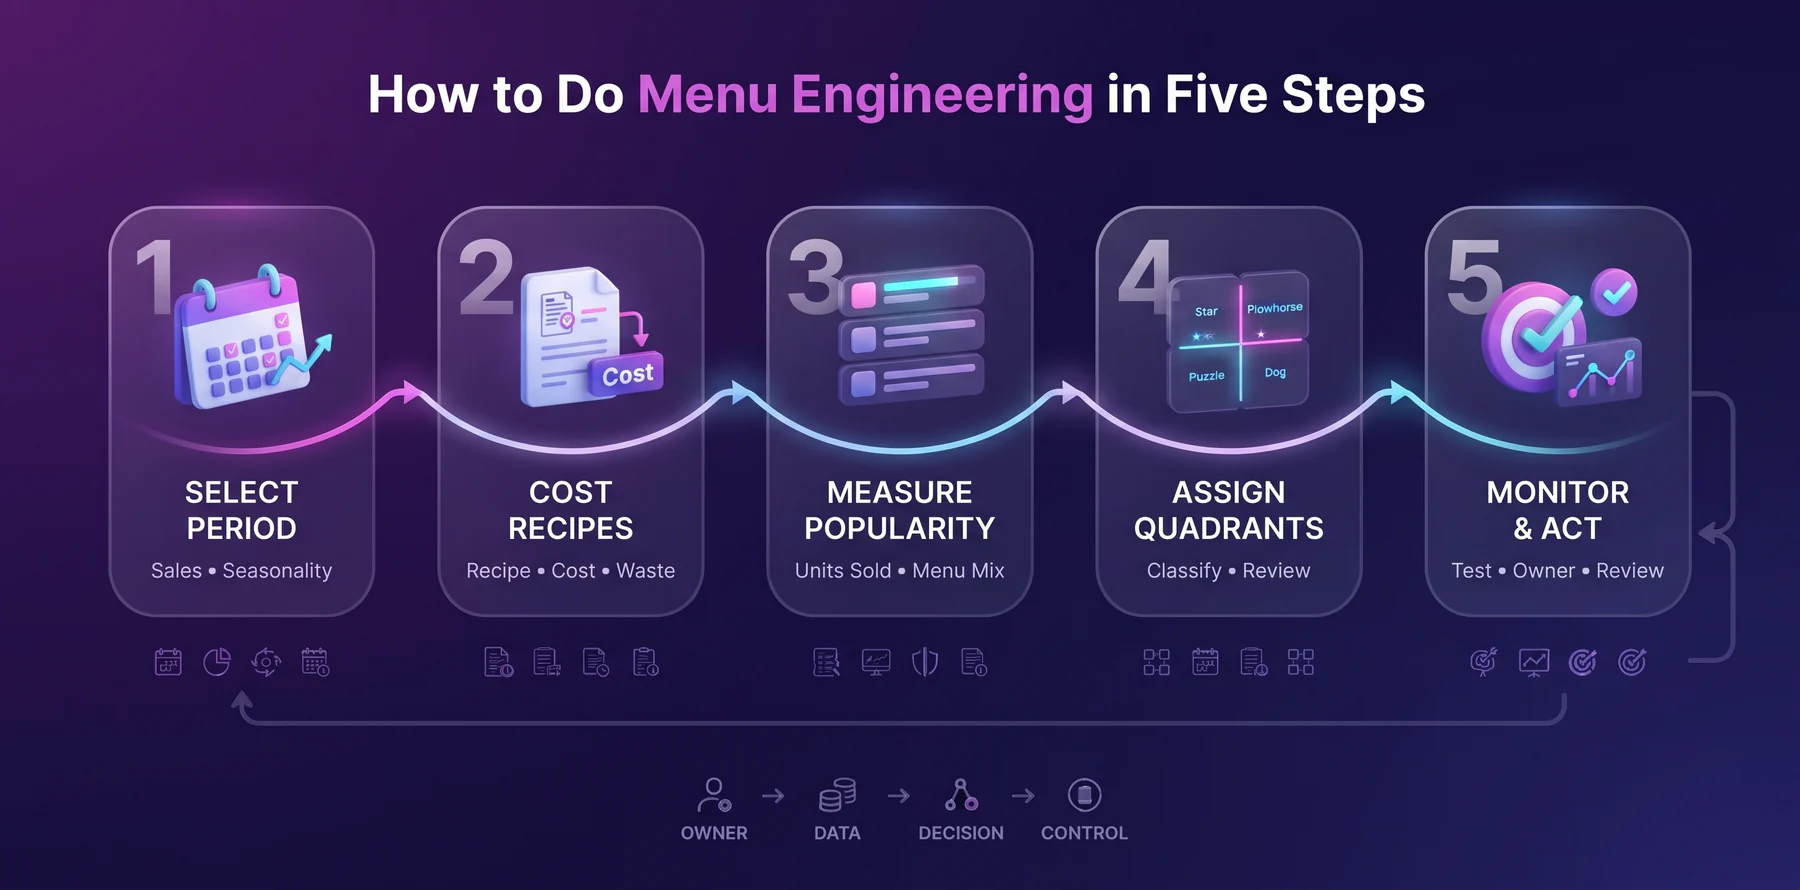
A repeatable menu engineering process combines analysis with ownership and control points. A reliable reporting process starts with the right system. Comparing the best restaurant POS systems can help restaurant teams choose tools that support sales tracking and menu analysis.
| Step | Owner | Data input | Decision | Control point |
|---|---|---|---|---|
| 1. Pick a representative period | Finance and operations | Sales calendar, closures, promotions, seasonality | Select a period that reflects normal demand | Record exclusions and compare appropriate periods |
| 2. Cost every recipe | Culinary, procurement, finance | Recipe version, purchase price, yield, waste | Confirm variable food cost per item | Approve recipe changes and cost dates |
| 3. Measure popularity | Finance or business intelligence | Units sold by item, outlet, channel | Set and document the popularity method | Check stockouts, voids, bundles, and discounts |
| 4. Assign quadrants | Finance with operations review | Menu mix and contribution calculations | Classify each item and flag anomalies | Require a second review for unusual results |
| 5. Decide and monitor | Operations, culinary, procurement, head office | Quadrant, customer feedback, waste, preparation time | Test, reformulate, reposition, price, retain, or retire | Set an owner, review window, and post-change measure |
- Choose the period. Avoid weeks dominated by closures, opening events, unusual holidays, severe stockouts, or one-off campaigns. The right duration depends on menu volatility, ingredient-price changes, outlet complexity, seasonality, and reporting capacity.
- Cost the recipes. Use the approved recipe or bill of materials, current purchasing information, yields, and documented waste assumptions. Version control matters when a supplier or portion changes.
- Measure popularity. Calculate units and menu mix by the relevant outlet and channel. Do not average branches blindly if a delivery menu has different pricing or commissions.
- Classify and investigate. Assign quadrants, then review anomalies with culinary, operations, finance, and procurement. A sudden margin change may be a data issue rather than a customer behavior change.
- Act and monitor. Define the test, approver, owner, expected measure, and review window. Monitor units sold, contribution, waste, discount rate, preparation time, stock usage, and customer feedback.
An integrated workflow can reduce manual reconciliation between sales, inventory, recipes, and finance. For example, an ERP review may sit alongside an ABC inventory analysis to identify ingredients whose cost or usage deserves closer attention. The technology makes the evidence easier to trace and repeat.
Strategies for Each Menu Engineering Category
Each category should trigger an action-and-investigation plan rather than an automatic menu change.
| Quadrant | First action | Second action | What to monitor | Review window |
|---|---|---|---|---|
| Star | Protect availability, recipe consistency, and service speed | Test small improvements without disrupting demand | Units, contribution, stockouts, preparation time, feedback | After normal trading cycles and any material change |
| Plowhorse | Review recipe cost, portion size, waste, discounting, and price logic | Test cost repair or repositioning while watching demand | Contribution, units, waste, complaints, discount rate | After an approved controlled test |
| Puzzle | Improve awareness, placement, description, or staff recommendation | Test promotion, bundle, portion, or channel fit | Units, conversion, margin, promotion cost, feedback | During a representative demand period |
| Dog | Verify data and strategic role before removal | Reformulate, reposition, limit availability, or retire with approval | Units, contribution, dietary coverage, bundle use, brand role | Before the next range or seasonal decision |
1. Stars
Protect Stars first. Confirm that recipe versions, purchasing availability, and execution standards remain stable. A popular item that goes out of stock can shift demand to lower-contribution alternatives. Monitor preparation time and waste so growth does not create an operational bottleneck.
2. Plowhorses
Repair a Plowhorse carefully. Review portion size, supplier prices, substitutions, packaging, and discounts before changing price. A margin improvement that damages demand may not improve total contribution. Culinary and finance should agree on the test, while operations monitors service impact.
3. Puzzles
Test Puzzles before judging them. Customers may not understand the description, see the item, or find it in the delivery channel. A clearer name, menu placement, staff recommendation, sampling, or bundle can be tested. Keep the test measurable and account for promotion cost.
4. Dogs
Do not remove a Dog automatically. It may provide vegetarian or allergy-conscious coverage, support a bundle, satisfy a seasonal expectation, or protect a brand promise. First verify the recipe cost, demand period, outlet segment, and strategic purpose. Removal, reformulation, or limited availability should follow the relevant approval process.
For teams assessing whether their systems support repeatable analysis, an audit trail helps document who changed a recipe, cost, price, or approval record and when. That traceability is particularly useful when a branch result changes after a supplier update or promotion.
Menu Engineering Across Multiple Branches
Multi-branch menu engineering works only when every outlet uses the same definitions and controls. In practice, Philippine groups rarely start there.
- Ingredient prices move differently per city, so the same adobo costs more in Cebu than in a Metro Manila commissary.
- Outlets also run different menus because of local demand, kitchen capacity, or mall tenant rules.
- Sales and cost reports then sit in separate branch spreadsheets, so head office cannot compare items on one basis.
The result is familiar. The same dish becomes a Star in a Makati outlet and a Dog in a provincial branch, and nobody can prove why.
Each review should record the outlet, sales channel, recipe version, ingredient cost, waste, and reporting period. Branch operations explain local demand and execution. Culinary, procurement, finance, and head office review recipe standards, supplier prices, contribution logic, and proposed changes. Menu decisions should also support consistent food safety controls. Restaurants can review guidance on HACCP in the Philippines when they standardize procedures across branches.
When branch spreadsheets stop reconciling, an ERP or MRP software for Philippine operations can connect recipe, purchasing, inventory, and production data in one record.
Conclusion
Menu engineering works best as a management routine, not a one-time project. Maintain a controlled recipe catalogue, record cost assumptions, reconcile sales with inventory usage, and keep the reason behind each menu change.
Match the review cadence to menu volatility. A fast-changing concept may need a monthly dashboard, while a seasonal menu needs a different cycle. Routine monitoring flags sudden shifts in units, cost, waste, or discounts, so a full analysis can investigate the cause. Compare like-for-like periods instead of publishing a single ranking without context.
If your sales, recipe, inventory, and purchasing data still sit apart, start with the outlets and items that matter most. HashMicro Restaurant POS System centralizes those records, so book a free consultation to see how the F&B solution fits your outlets.
FAQ Around Menu Engineering for Philippines
Review your menu engineering analysis every 3–6 months, or whenever you update your menu significantly. Seasonal shifts in food cost and changes in customer demand can move items between quadrants. More frequent reviews (monthly) are useful for high-volume restaurants or those with volatile ingredient prices.
Restaurant POS systems with built-in sales reporting are the most common tool. They track item-level sales volume and revenue automatically. More advanced restaurant management platforms let you run menu mix analysis and profitability reports without manual spreadsheet work.
Menu engineering is the data analysis side — it tells you which items are profitable and popular. Menu design is the visual and physical presentation of the menu. The two work together: engineering identifies what to promote, design determines how to position those items visually to guide customer choices.
Yes. Even a small restaurant with 20–30 menu items benefits from categorizing dishes by margin and popularity. The math is straightforward and can be done in a spreadsheet. The key is having accurate food cost data for each dish and reliable sales numbers, both of which a POS system provides automatically.