









 Limited to 100 registrants

A planogram is a visual guide showing where to place each product on a retail shelf, display, chiller, or rack. It tells store teams which SKUs go where, how many facings each product should get, and how the shelf should look after restocking.
This matters especially in Philippine retail, where shelf space is tight and fast-moving products compete for visibility. Small local grocery stores dominate the market. A 2026 Agriculture and Agri-Food Canada report found that these stores generated US$37.4 billion (₱2.34 trillion) in 2024. That equals 63.5% of total grocery retail sales.
This guide explains the meaning of a planogram, how it differs from store layout and POP displays, the main types, a simple worked example, and how retailers can build and measure one even before using planogram software.
Key Takeaways
A planogram is a shelf-level diagram that assigns each product's position, facing count, and shelf level, distinct in scope from store layouts, floor plans, and POP displays.
Each facing count is calculated from daily sales velocity and restock cycle, which explains exactly why one SKU occupies eye level while another sits at the bottom.
Any store can build a planogram without software in six steps, from shelf measurement and SKU sales data to a facing formula and photographed shelf reference.
A spreadsheet works for single-branch stores, but retail software becomes necessary as branch count and SKU range grow to connect planogram decisions to live sales and inventory data.
What Is a Planogram?
A planogram is a visual diagram that shows how products should be arranged on a retail fixture. It maps each product's SKU, shelf level, facing count, category section, and fixture dimension. The planogram's meaning in retail is practical: it is the shelf rulebook that keeps product placement consistent.
Merriam-Webster defines it as "a schematic drawing or plan for displaying merchandise in a store to maximize sales," but retailers also call it a POG, plan-o-gram, or shelf plan. Larger retailers build planograms in specialized software, while smaller stores often start with a spreadsheet or photo reference.
A planogram shows which products sit on the shelf, where each item goes, and how many facings each product gets. It marks eye-level placements and guides restocking. Beyond neat shelves, it helps match shelf space with sales, reduce stockouts, and keep displays consistent across branches.
Planogram vs. Store Layout vs. POP Display vs. Floor Plan
Retail teams often confuse planograms, store layouts, POP displays, and floor plans. All four tools shape how a store looks and operates. Each one controls a different scope, from individual shelf positions to the physical structure of the entire building.
| Term | Scope | Author | Regulated Units | Frequency of Change |
|---|---|---|---|---|
| Planogram | Product placement on shelves, racks, displays, or chillers | Merchandising or category manager | Individual SKUs, facing counts, shelf positions | Monthly, seasonal, or when SKU performance changes |
| Store layout | Customer flow, aisle placement, department zones, checkout location | Retail operations or store planning team | Departments, aisles, zone boundaries | Rarely, during store redesign |
| POP display | Promotional display near checkout, aisle ends, or high-traffic areas | Marketing team or supplier | Promotional campaign items | Frequently, per campaign schedule |
| Floor plan | Physical layout of store building, fixtures, walls, and service areas | Architect or facilities team | Fixtures, walls, structural areas | Very rarely, during renovation |
The key difference is scope. A planogram places individual SKUs, facing counts, and shelf positions. A formal store layout positions departments and aisles. A great floor plan does not guarantee a good shelf plan.
Unlike a point-of-purchase display, which is temporary and campaign-driven, a planogram controls permanent shelf arrangement. POP displays respond to marketing calendars. Planograms respond to sales data and category strategy. A floor plan is wider still, showing the physical structure and fixture locations of the entire store.
Types of Planograms
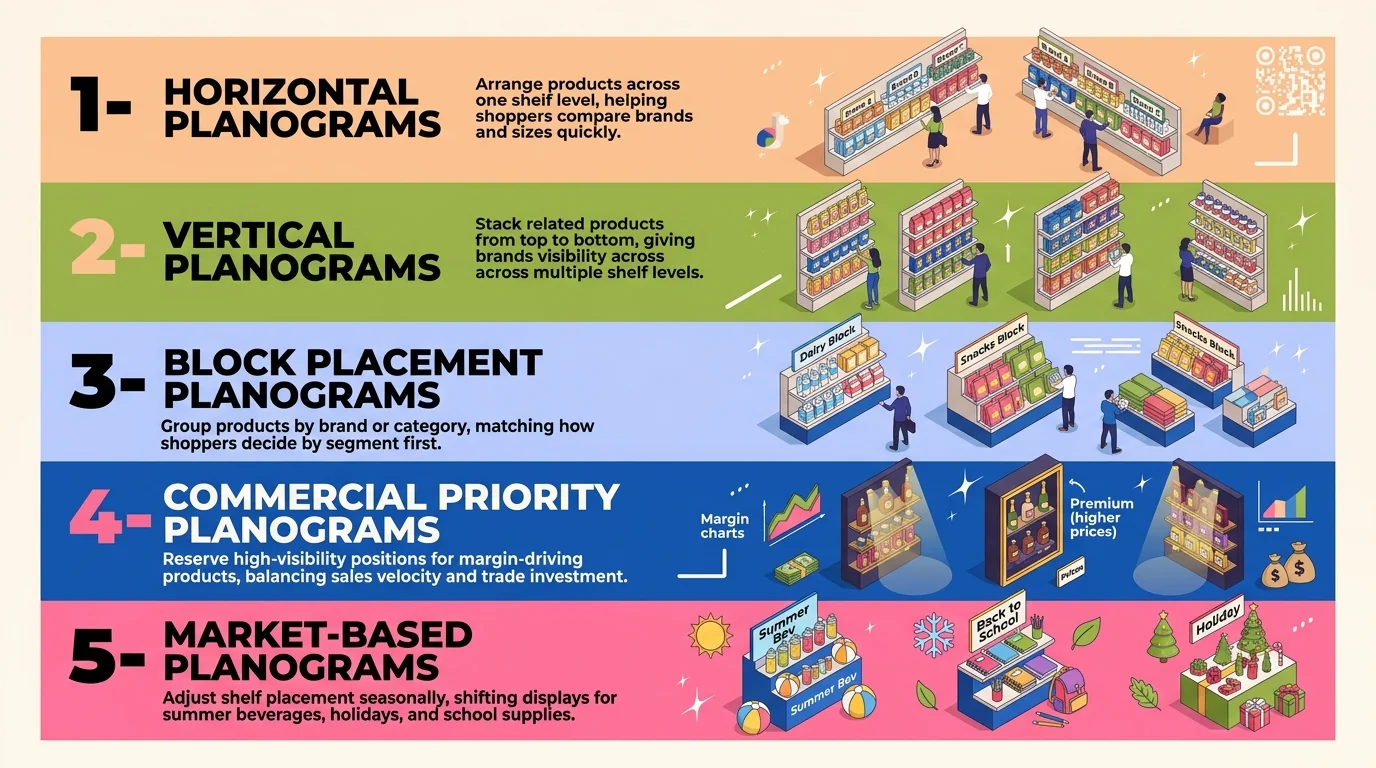
Philippine retailers use different planogram types depending on store size, shelf goals, and how shoppers make buying decisions. The right choice determines whether products are arranged to drive comparison, reinforce brand visibility, or align with commercial priorities and seasonal demand.
1. Horizontal Planogram
A horizontal planogram arranges related products across one shelf level, from left to right. Shoppers can compare brands, flavors, or sizes in a single glance. Convenience stores like 7-Eleven and Ministop use this for beverages, instant noodles, and snacks where shoppers decide quickly between similar options.
2. Vertical Planogram
A vertical planogram stacks related products from the top shelf to the bottom. This groups a brand or category into a visible block across multiple shelf levels. Supermarkets like SM Hypermarket and Robinsons use this for personal care and dairy, where brand visibility matters across a wide aisle.
3. Block Placement Planogram
A block planogram groups products by brand, category, flavor, or price tier. Shoppers who decide by category first, then by variant, respond well to this layout. Small local grocery stores use block planograms to separate product brands and segment flavors or variants inside each brand block.
4. Commercial Priority Planogram
This type reserves better shelf positions, especially eye level, for products with high margins, fast sales, or supplier funding. The goal is to balance sales velocity, margin, and trade investment on one shelf. Supermarkets, pharmacies, and convenience stores in the Philippines rely on this to maintain profitability.
5. Market-Based and Seasonal Planogram
This type adjusts shelf placement based on demand periods and local market behavior. Beverage displays expand during the Philippine summer. Grocery chains shift gift packs and holiday items to front-end shelves before Christmas. School supply sections grow in June when classes resume in public and private schools.
Why Planograms Matter for Philippine Retailers
Shelf space is limited across most local store formats, product counts run high, and restocking happens multiple times a week. These pressures show up in sari-sari stores, convenience stores, supermarkets, and pharmacies, each with a different planogram problem to solve.
1. Sari-Sari Stores
Sari-sari stores have almost no dedicated shelving. Products share space across hanging packs, small ledges, coolers, and the counter itself. A planogram identifies the items that need the most visible positions and the products that are slow-moving enough to cut.
2. Convenience Stores
Convenience stores run on fixed-width gondolas, and each fixture type, from chillers to countertop racks, handles a specific category. Customers decide fast, so top sellers need to occupy the same slot in every store. A planogram sets that standard and keeps restocking consistent across shifts.
3. Supermarkets
Supermarkets carry hundreds of SKUs per category, and shelf space runs across dozens of aisles and gondola bays. Without a planogram, each category manager sets their own shelf rules, and brand placement varies between branches. A planogram standardizes that across the entire store network.
4. Pharmacies
Pharmacies mix prescription areas, over-the-counter shelves, vitamins, and personal care products in a compact floor plan. This proximity creates clutter when shelf assignments drift. A planogram keeps each product category in a fixed zone so customers can locate items quickly without staff help.
Without a planogram, staff at each branch arrange shelves by habit. One store over-shelves a slow-moving SKU while another stocks out of a fast seller that only gets one facing. A planogram gives every team a visual target and gives managers a way to verify the shelf.
Planogram Example: One Shelf Section Broken Down
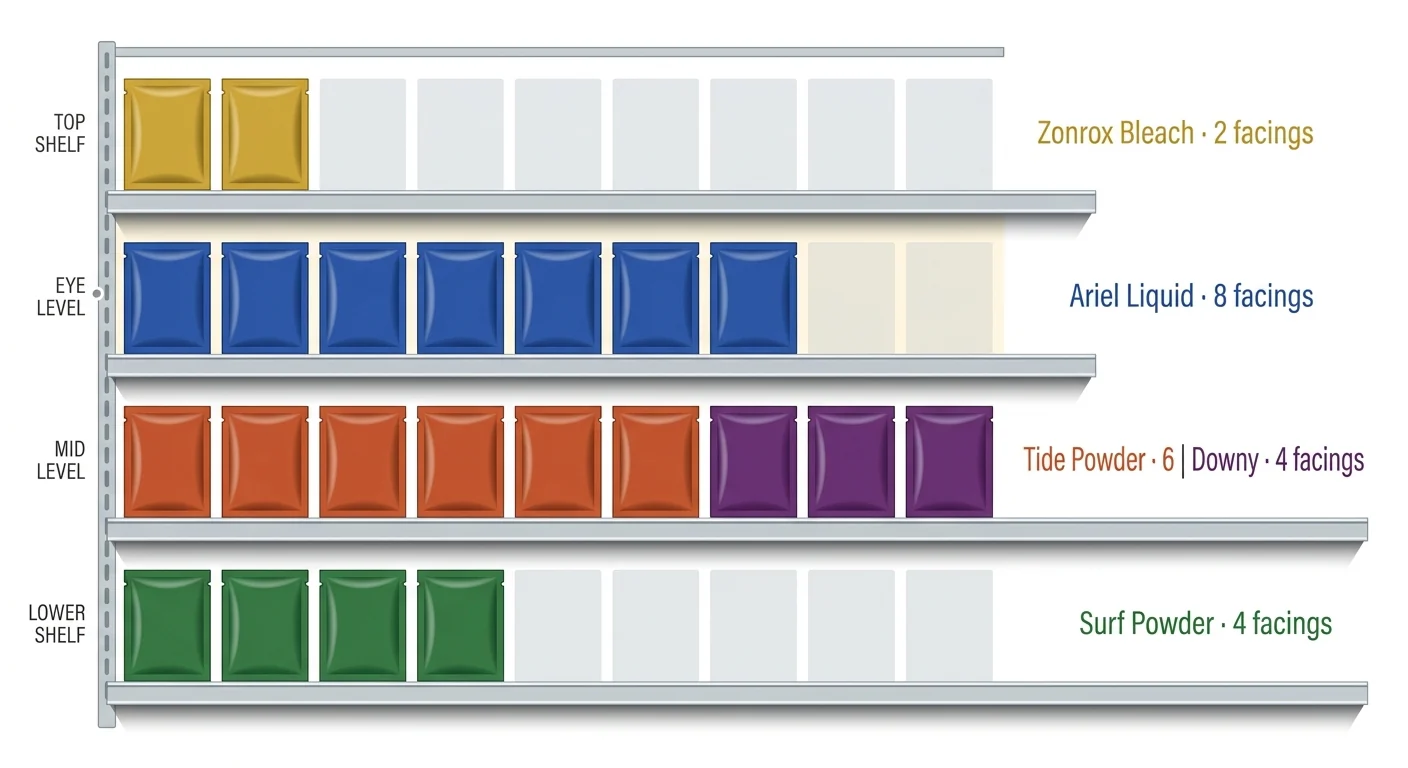
A shelf that looks full can still fail commercially. A common mistake is putting colorful sachets at eye level because they stand out. Meanwhile, the fastest-moving SKU gets buried at the bottom where shoppers rarely look first.
This planogram example uses laundry care sachets, available in sari-sari stores, convenience stores, and supermarkets. Sachet unit sizes are small and restock windows are short. These conditions make laundry care one of the clearest planogram examples for studying how facing allocation drives replenishment outcomes.
Before: Arranged by Appearance
In the version below, the shelf owner sorted products by packaging color. Bright yellow and purple sachets moved to eye level. The fastest and second-fastest SKUs dropped to lower positions.
| Position | Product | Facings | Why This Fails |
|---|---|---|---|
| Eye level | Zonrox Bleach Sachet | 4 | Sells only 6 units/day. The fastest SKU is hidden below. |
| Mid level | Downy Fabric Conditioner | 6 | Tide is not adjacent. The cross-sell opportunity is wasted. |
| Lower shelf | Ariel Liquid Sachet | 4 | The fastest SKU at 36 units/day. Shoppers must crouch to find it. |
| Lower shelf | Tide Powder Sachet | 6 | Second-fastest SKU shares a crowded lower shelf with no separation. |
| Top shelf | Surf Powder Sachet | 4 | Budget alternative is out of sight for most shoppers. |
The shelf looks stocked and visually balanced. However, placing the two fastest SKUs at lower positions means the store loses impulse sales every time a shopper scans the section without looking down.
After: Arranged by Velocity and Shelf Logic
The revised arrangement reassigns each position based on daily sales, restock cycle, and purchase behavior. No shelf level or facing count is arbitrary. Each reflects a specific commercial reason.
| Product | Daily Sales | Restock Cycle | Facings | Shelf Level |
|---|---|---|---|---|
| Ariel Liquid Sachet (10g) | 36 units | 2 days | 8 | Eye level |
| Tide Powder Sachet (55g) | 30 units | 2 days | 6 | Mid level |
| Downy Fabric Conditioner (27ml) | 20 units | 2 days | 4 | Mid level (cross-sell) |
| Surf Powder Sachet (55g) | 18 units | 2 days | 4 | Lower shelf |
| Zonrox Bleach Sachet | 6 units | 2 days | 2 | Top shelf |
- Top shelf: Zonrox Bleach Sachet (2 facings)
Zonrox sells only 6 units per day, the lowest velocity SKU in this section. Shoppers who need bleach seek it out deliberately. Top shelf placement does not reduce its sales because the purchase decision is need-driven, not impulse-driven.
- Eye level: Ariel Liquid Sachet (8 facings)
Ariel is the section's fastest SKU at 36 units per day. Eight facings hold two full days of stock before restock. Eye level is where impulse purchases happen, so the highest-velocity product belongs here.
- Mid level: Tide Powder Sachet (6 facings) + Downy Fabric Conditioner (4 facings)
Tide earns mid level at 30 units per day. Downy sits directly beside it. Shoppers grabbing detergent often reach for fabric conditioner in the same motion. Adjacent placement converts that behavior without requiring a separate trip.
- Lower shelf: Surf Powder Sachet (4 facings)
Surf sells 18 units per day and targets price-sensitive shoppers. Price-conscious buyers deliberately check lower shelves for cheaper options. Placing Surf here is intentional. It keeps premium SKUs visible at eye and mid level while keeping the budget alternative within reach.
How to Create a Planogram Step by Step
Building a planogram does not require specialized software. Start with one shelf, one category, and actual sales data. A basic spreadsheet, your POS report, and a measuring tape are enough. Together, they produce a planogram that allocates space by commercial priority rather than visual preference.
Step 1: Measure the Shelf and Note the Fixture Dimensions
Record the width, height, depth, and number of shelf levels. Note any structural constraints such as pillar positions, fixed fittings, or overhead lighting. These measurements set the boundaries for every facing count and position decision that follows.
Step 2: Pull Sales Data per SKU from Your POS
Export a sales report by SKU from your point-of-sale system. Aim for at least 14 days of data to capture day-of-week variation. Each row should include SKU name, units sold per day, and restock cycle.
Step 3: Group SKUs into Product Categories
Group products by how shoppers typically buy them. Common groupings use brand, flavor, size, or usage occasion. A well-designed store layout makes this step easier because shoppers expect related products to sit near each other. Avoid grouping by supplier or packaging color.
Step 4: Calculate the Number of Facings
Use daily sales velocity and restock frequency to assign facing counts. A product that runs out before the next delivery needs more facings to hold the full restock window.
Formula:
Facings = (Units sold per day × Days between restock) ÷ Units per facing
Example: 36 units/day × 2 days ÷ 9 units per facing = 8 facings
After assigning facings, compare space share against sales share. If a SKU holds 25% of facings but contributes only 5% of category sales, it is over-allocated. That space belongs to faster-moving products.
Step 5: Set Vertical Position, Eye Level for Priority
Assign shelf levels based on velocity and commercial priority. Eye level and hand level hold fast-moving and high-margin SKUs. Lower shelves suit heavier or budget products. Top shelves work for low-velocity items that shoppers seek deliberately.
Step 6: Draw, Apply, and Photograph the Result
Sketch the layout in a spreadsheet or drawing tool. Label each product, facing count, and shelf level clearly enough for staff to follow during restock. After arranging the shelf, take a reference photo.
Formula:
Compliance (%) = (Correct positions ÷ Total positions checked) × 100
Use the photo as your audit standard for compliance checks. Revisit the planogram when sales patterns shift, after promotions, or after a repeated stockout.
Measuring Planogram Compliance
Planogram compliance measures how closely a shelf matches the approved plan. Most stores already have a planogram. The problem is that daily restocking quietly undoes it. Staff restock from habit, suppliers move products, and stockouts leave gaps. Without a compliance score, no one can see the drift.
Compliance (%) = (Correct positions ÷ Total positions checked) × 100
A score of 85 means 15 of every 100 positions do not follow the plan. For small stores, a weekly photo audit is realistic. The manager photographs each shelf section, checks positions against the planogram, counts mismatches, and records the score. The process takes under 20 minutes.
A low score does not always mean the staff failed. The planogram may not fit the branch's actual shelf dimensions. Instructions could be unclear, or restocking schedules may conflict with the plan. Branch comparisons show which locations have a structural issue versus an execution problem.
Some signs point to revision, not enforcement. If a SKU sells out before the next restock, it needs more facings. If a product holds full facings but barely moves, it needs fewer. Staff who consistently skip the same position are telling you the layout does not fit the actual restocking flow.
Tools: From Spreadsheet to Retail Software
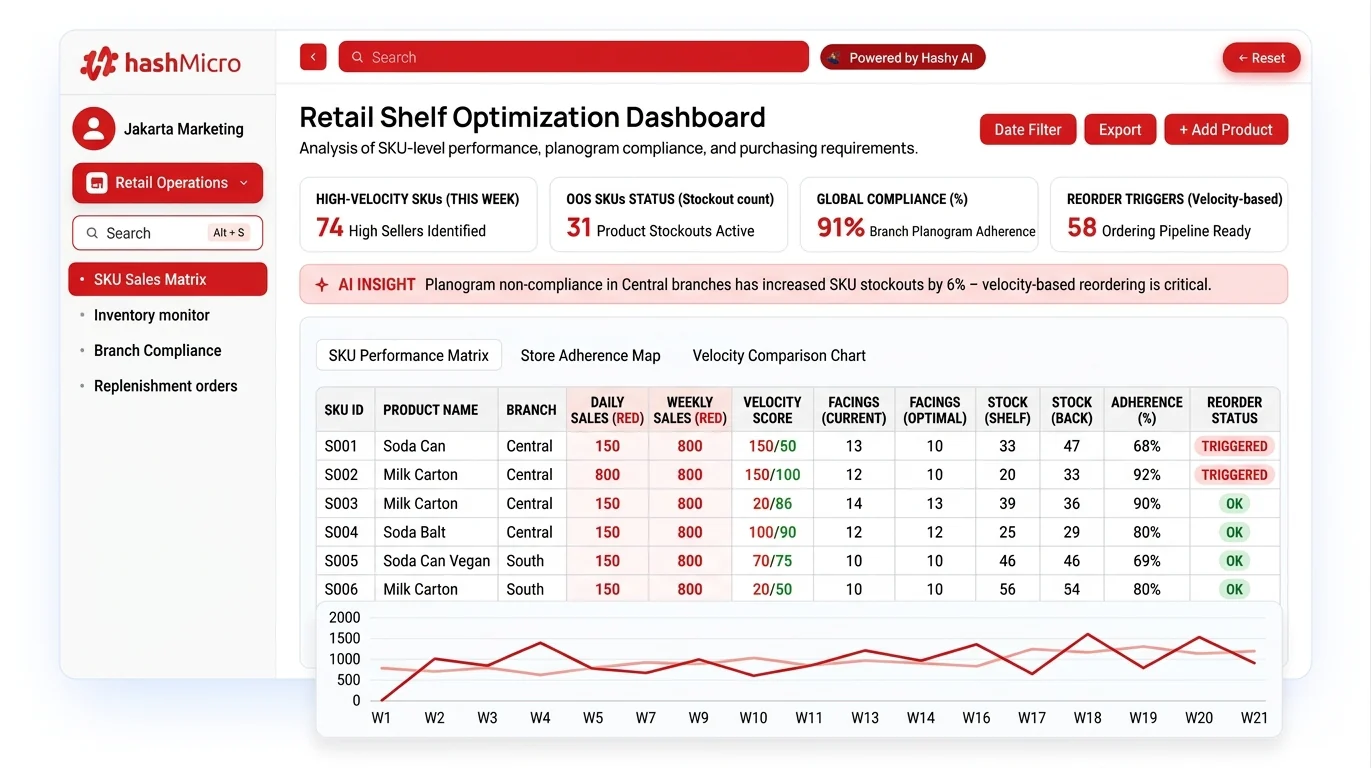
A spreadsheet, a shelf photo, and a printed diagram work for a single-branch store with a stable, small SKU count. One person can verify the shelf, update the record, and restock from the same file. Retail software solves a different class of problems.
Retail software helps store teams track SKU-level sales, monitor live shelf stock, and compare branch performance from one screen. These capabilities make shelf decisions faster and more accurate. HashMicro's retail software covers all three, with purchase planning integrated into the same platform.
HashMicro's retail management software includes four capabilities that directly support planogram execution:
- SKU-level sales tracking: View daily and weekly sales per product to identify which SKUs deserve more shelf space and which carry too many facings for their velocity.
- Real-time inventory monitoring: Track current shelf stock across all branches without manual counts or store phone calls.
- Branch uniformity reporting: Compare planogram compliance across locations and flag which stores consistently deviate from the approved shelf plan.
- Integrated purchase planning: Connect shelf performance to reorder decisions so replenishment follows actual sales velocity, not estimates.
For a growing retail business, the path is straightforward. Start with a manual planogram for one category. Test it and measure compliance. As branches and SKUs multiply, connect the process to live inventory and sales data through a dedicated retail system.
Conclusion
A planogram is a decision system, not a drawing. It sets where each product goes, how much facing it earns, and whether the shelf still matches the plan after restocking. The compliance score tells you whether that decision holds across every shift and every branch.
The process starts small. Pick one shelf and pull SKU-level sales data. Calculate facings, assign shelf levels by priority, photograph the result, and measure compliance weekly. Each step applies to sari-sari stores, convenience stores, supermarkets, and pharmacies the same way.
HashMicro retail software connects planogram decisions to live sales, inventory, and replenishment data across branches. As store count and SKU range grow, consistent shelf execution becomes harder to maintain manually. Request a free consultation to see how shelf performance can be tracked and managed consistently across every location.

FAQ About Planogram
A planogram is a diagram that maps every product's position, facing count, and shelf level on a retail fixture. It turns shelf space into a commercial decision rather than a visual arrangement. Stores use planograms to connect product placement with sales velocity and replenishment timing.
A store layout positions departments, aisles, and checkout areas across the entire floor. A planogram operates at the fixture level, assigning each product's shelf position, facing count, and shelf level. A store layout determines where shoppers walk. A planogram determines what they see on the shelf.
Planograms are created by merchandising teams, category managers, or retail operations teams in larger chains. Smaller stores rely on the owner or supervisor. Either way, the creator needs sales data per SKU, shelf dimensions, and restock cycle information to produce a commercially accurate plan.
Yes. A small store can start with a spreadsheet, a shelf photo, and a printed diagram. The key is to define product positions, facing counts, and shelf levels clearly enough for staff to follow during restocking. A photo of the completed shelf serves as the compliance reference.
A planogram should be reviewed when sales patterns shift, products change, or repeated stockouts occur before the next restock. High-velocity categories typically need monthly review. Seasonal categories need review before each demand period starts. A compliance score that keeps dropping is also a reliable signal to revise.
Planograms fail when facings ignore sales velocity, shelf sizes are assumed rather than measured, or the plan is never audited after rollout. Daily restocking by habit quietly undoes the layout. Low compliance scores across branches confirm the failure long after it starts.