










 Limited to 100 registrants

Most counter owners check average transaction value the same way. The number sits in the sales report, but looks lower than expected, and no one can explain why. The wholesale and retail sector earned PhP 6.88 trillion in 2022, per the Philippine Statistics Authority, making POS errors costly.
In Philippine retail and food service, that gap is rarely a selling problem. It is usually a reading problem. Voided tickets stay in the count. One table paying separately becomes four transactions. The report may show a VAT-inclusive base while the owner thinks in VAT exclusive terms.
This article breaks down the number in the order a counter actually works. You will locate average transaction value in your POS report, calculate it correctly, and remove the four distorting factors. You will then build a baseline, raise the number at the counter, and confirm the lift held.
Key Takeaways
Lock the period, use gross sales, count only completed tickets, then divide: ₱84,000 ÷ 420 = ₱200.
No verifiable Philippine benchmark exists, so build a baseline from your own counter and check the distribution first.
A real lift keeps volume: ₱220 × 420 = ₱92,400. A false one gives ₱84,040, effectively flat.
Ask four closed questions about voids, cashier breakdown, split bills, and VAT basis before trusting any reported average.
What Average Transaction Value Measures
Average transaction value, or ATV, is the average amount a customer pays in one completed transaction. Divide gross sales for a period by the number of completed transactions in that same period. A completed transaction means one ticket that was rung up, paid, and closed.
The metric answers a narrow question: how much value leaves the counter each time a ticket closes. It does not tell you how many customers you served or how often they came back. Pair it with customer lifetime value once you know your repeat rate.
ATV Is Not the Same as Average Order Value
Retail Dogma writes "ATV aka AOV" and treats the two as one metric. For a counter business, they are not. Average order value counts one online order. Average transaction value counts one ticket closed at a physical counter.
That gap changes which tactics work. The same customer can walk into your store three times in one day and create three transactions. A free shipping threshold cannot lift that number, and a cashier prompt cannot lift an online order value.
Basket Size and Ticket Size Mean the Same Thing
Your POS vendor may label the same number average basket size or average ticket size. Retail systems lean toward basket, food service systems lean toward ticket or check. Treat all three as synonyms for average transaction value.
Still confirm the computation before you compare two branches on different systems. Two stores can print the same label and calculate on different bases, such as VAT inclusive versus VAT exclusive sales.
Finding ATV in Your POS Report
Before you compute anything by hand, check whether your POS report already shows average transaction value. Most systems calculate it for you. Retail Dogma recommends exporting to Excel and dividing manually. If your POS already does the math, exporting only adds a step where mistakes happen.
Where It Sits in a Daily Sales Summary
Open the daily sales summary, the same document your supervisor closes the day with. Look for a block near the sales totals that pairs a peso figure with a transaction count. The average usually sits under or beside those two numbers because it comes from them.
If your store already runs a structured daily sales report, this is the same document. You are reading a different line on it, not creating a new report. The only work is finding the line once and remembering its label.
The Names Your POS Gives It
| Field name you may see | What it usually computes | Where it appears |
|---|---|---|
| Average sale | Gross sales ÷ completed tickets | Daily sales summary |
| Average check | Gross sales ÷ closed checks | Restaurant end of day report |
| Average basket | Gross sales ÷ baskets paid | Retail sales dashboard |
| Average ticket | Gross sales ÷ tickets closed | Z-reading or shift report |
| Avg. per transaction | Gross sales ÷ transaction count | Terminal or cashier report |
The detail almost nobody checks: one POS report may clean voids from the average while another keeps them. Two branches can show different averages on identical sales for that reason alone. Verify this once, in writing, before you trust any comparison between branches.
Reading It from a Z-Reading Instead
If your POS does not surface the average directly, the Z-reading still gives you both inputs. It closes the shift, locks the totals, and prints gross sales and the ticket count together.
Use the Z-reading rather than a mid-shift screen. A running total moves while you read it. A figure captured at 4 p.m. will not match the one your bookkeeper sees the next morning.
Pulling ATV by Shift, Cashier, and Branch
A single store-level average hides most of what is useful. The same counter can run one average during the lunch rush and a very different one in the evening. Two cashiers on the same shift can sit twenty percent apart.
Pull the number by shift, by cashier, and by branch as soon as your system allows it. A store average tells you there is a problem. A cashier-level average tells you where to coach.
Computing ATV Correctly
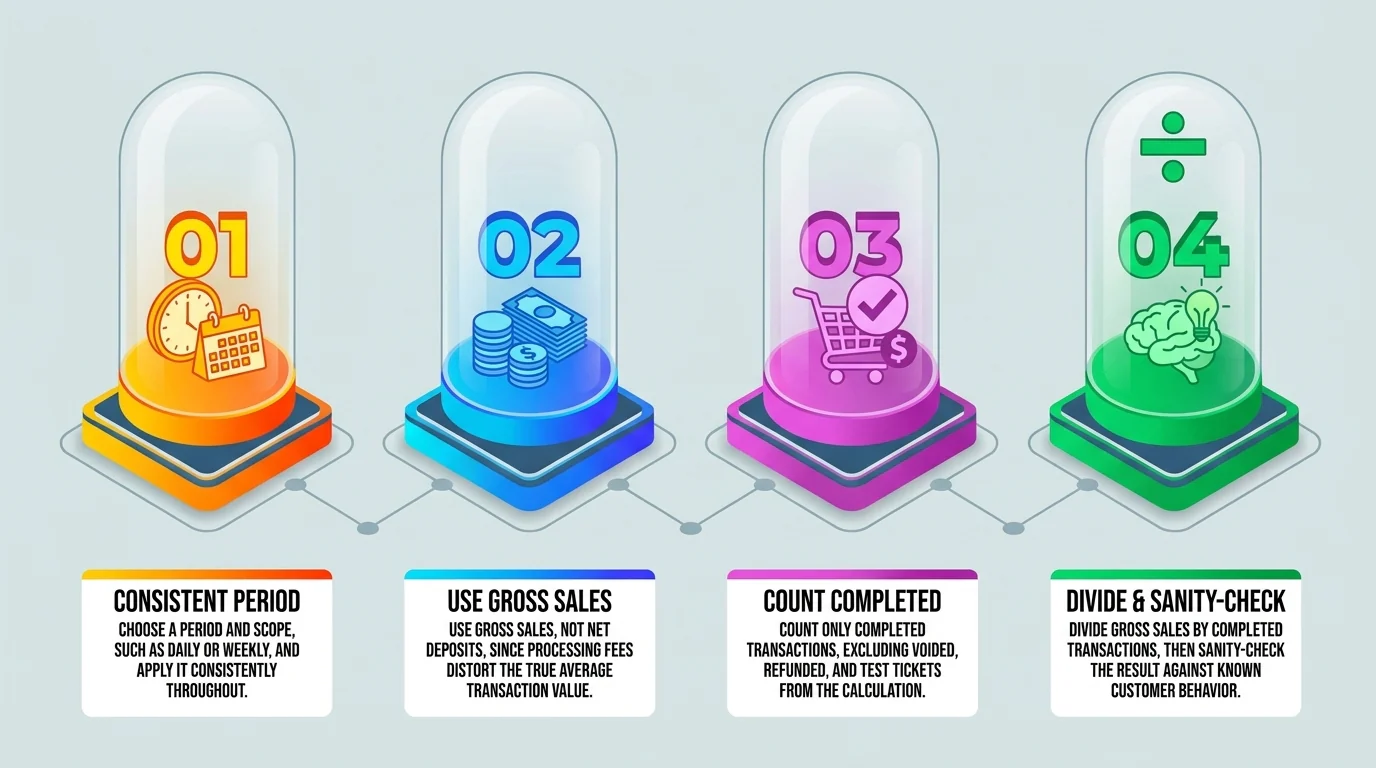
If your POS does not compute the average, you can still verify the number yourself. You need to know how to calculate average transaction value. Work through four steps in order. Keep the period and the basis fixed across all of them so the result stays trustworthy.
Step 1: Pick the Period and Lock It
Choose a period and use it consistently. One day, one week, or one month. Mixing a weekly sales total with a daily transaction count produces a number that means nothing. Average transaction value only works when both inputs cover the same period.
Also lock the scope. Use one branch, one store, or the whole chain. Never combine a sales figure from the group with a ticket count from a single counter, or the result will mislead you.
Step 2: Take Gross Sales, Not Net Deposits
Use gross sales, meaning what customers actually paid, not the amount that reached your bank account. Card and e-wallet deposits arrive after processing fees are deducted. If you divide the net deposit by your transaction count, the result is lower than what customers really paid.
The gap grows as digital payments take a larger share of your sales. Processing fees belong in your cost analysis alongside gross profit margin, not inside a sales average. Average transaction value should reflect what customers paid, not what the bank deposited.
Step 3: Count Completed Transactions Only
Count tickets that ended in a completed sale. Remove voided tickets, refunded tickets, and any training or test tickets created while staff was learning the system. This step decides whether your average transaction value is trustworthy, and it is the step most reports skip.
Step 4: Divide, Then Sanity-Check the Result
Divide gross sales by completed transactions, then compare the result against what you know about the store. Your typical customer buys one item priced around ₱200. If the report shows a much lower average, something in the count is wrong.
The sanity check is not optional. An average transaction value that contradicts what staff see at the counter every day is a data problem until proven otherwise. Trust the register tape and the daily total over a suspicious average.
A Worked Example in Pesos
One trading day at a single branch gives gross sales of ₱84,000 across 420 completed transactions. That gives an average transaction value of ₱200. Every figure in the rest of this article builds on that same day.
Average Transaction Value = Gross Sales ÷ Completed Transactions
₱84,000 ÷ 420 = ₱200
Why Your ATV Number Looks Wrong
Four mechanical causes push your average transaction value below its real level. None of them involve customer behavior. Each one shows up the same way whether your report labels the number average basket size or average ticket size. Work through them in order.
1. Voids and Refunds Still in the Count
Take the same trading day and assume 15 voided tickets stayed in the transaction count. The average transaction value formula still divides ₱84,000, but now by 435 tickets instead of 420. Sales never changed. The reported average falls anyway.
₱84,000 ÷ 435 tickets = ₱193.10
True ATV ₱200.00. Understated by ₱6.90, or 3.4 percent.
Refunds do the same in reverse. The sale is undone, but the ticket often stays in the count. Check whether your BIR-accredited POS system strips voided tickets from the average before you trust any comparison between branches.
2. Split Bills Inflating Your Transaction Count
One table spends ₱1,200, and four diners pay separately. The POS records four transactions of ₱300. Gross sales hold steady, but the divisor grows by three. Twenty tables like that add 60 artificial tickets in a single day.
₱84,000 ÷ 480 tickets = ₱175.00
True ATV ₱200.00. Understated by ₱25.00, or 12.5 percent.
Decide how your business treats split bills and apply that rule every day. Never compare a period before the rule with a period after it. The gap you measure would come from the rule, not from your guests.
3. Discounts Applied Before or After the Line
Discounts decide whether a ticket records at list value or at the amount the customer actually paid. Suppose the same day carried ₱4,200 in discounts. One system reports ₱88,200 in gross sales and another reports ₱84,000.
List basis: ₱88,200 ÷ 420 = ₱210.00 | Net basis: ₱84,000 ÷ 420 = ₱200.00
Same day, two bases. A gap of ₱10.00, or 5 percent.
Consistency matters more than which basis you pick. If a promotional month records discounts on one basis and the next month switches, the movement in your average comes from configuration, not from customer behavior.
4. VAT Included or Excluded Changes the Answer
Your POS may report sales on a VAT inclusive basis while your finance team reads them as VAT exclusive. The same ₱200 average then produces two different numbers. Divide the inclusive figure by 1.12 to reach the exclusive one.
₱200.00 ÷ 1.12 = ₱178.57
A gap of ₱21.43. That difference is the 12 percent VAT, not a change in what customers spent.
BIR Revenue Memorandum Order No. 12-2012 defines monthly sales as the gross monthly total sales subject to value added tax, whether taxable at 12 percent or zero-rated. Confirm which basis your report uses before you compare branches, set targets, or report average transaction value upward.
If your store is still checking its setup against local rules, start with your official receipt requirements.
What a Healthy ATV Looks Like
A good average transaction value has no universal answer. Start by building a baseline from your own counter before comparing results or setting targets. Your historical data shows what normal looks like under your pricing, customer mix, and reporting rules. Without that verified baseline, any benchmark can mislead your decisions.
1. Why Industry Benchmarks Mislead You
No verifiable average transaction value benchmark exists for the Philippine market by industry. Figures circulating online come from other markets, other currencies, and other basket compositions.
They rarely state whether voids were excluded or which VAT basis the report used. A benchmark you cannot reconcile is worse than no benchmark.
2. Building a Baseline from Your Own Counter
Use your own history instead of a borrowed benchmark. You already know how to calculate average transaction value. Apply that formula to the last eight to twelve weeks of data from your POS report. Separate weekdays from weekends and note any promotions or holidays.
That range becomes your baseline. Any target you set later is measured against your own counter, under your own rules, on your own VAT basis.
3. When the Average Hides a Two-Peak Day
An average of ₱200.00 can hide two completely different populations. A counter may run mostly ₱80 tickets at lunch and mostly ₱600 tickets on weekends. The daily average sits in the middle and describes neither crowd.
Before you pick a tactic, look at the distribution. Bundling works on the ₱80 crowd while threshold offers work on the ₱600 crowd. One number cannot tell you which group you serve. That problem stays the same whether your POS report calls the figure average basket size or average ticket size.
4. Reading ATV Alongside Transaction Count
Never read the average alone. Transaction count belongs next to it because the two move against each other more often than owners expect. Keep the pairing narrow. The question here is value per transaction and how many transactions produced it, not sales per day.
Daily sales performance belongs in your daily sales report. Stock level questions belong with your inventory turnover ratio.
Raising ATV at the Counter
Once the average transaction value is clean and the baseline is set, focus on actions at the counter. Five upselling techniques can lift revenue without adding customers. Each tactic needs a clear condition, a usable cashier behavior, and a measurement rule. The right choice depends on customer intent, product fit, and your POS report.
After learning how to calculate average transaction value, the question “what is average transaction value?” becomes practical. How much value can each ticket create? Raising ATV from ₱200 to ₱220, a 10% increase, across 420 daily transactions adds ₱8,400 per day and ₱252,000 over 30 trading days without new customers.
Impact of ATV Increase = (New ATV − Current ATV) × Transactions
(₱220 − ₱200) × 420 = ₱8,400/day = ₱252,000/month
1. Use Bundling When Products Naturally Belong Together
Use bundling when the products naturally belong together, and customers already show interest in one item. A drink with a meal, a phone case with a device, or a refill with a first purchase can raise average transaction value without making the offer feel forced.
Make the saving visible beside the bundle price. Do not make customers calculate separate prices during a busy queue. Track bundle uptake, average transaction value, and margin together. A bundle that raises average basket size but removes profitable individual purchases needs a closer review.
Bundling also fits stores with predictable product combinations. Review your sales history before creating the offer. Choose items that customers already buy together instead of combining slow-moving stock with popular products.
2. Offer Upgrades With a Clear Price Difference
Use an upgrade when the larger size or better version has a clear benefit. The price difference should feel easy to understand and small enough for an immediate decision. This tactic suits products with strong perceived value, predictable costs, and enough margin to support the upgrade.
Give cashiers three phrases per shift they can repeat without thinking: “Would you like the large for ₱40 more?” “Add the pastry for ₱75?” and “The combo saves ₱20.” Then compare acceptance by cashier and product. The goal is offering a relevant next choice, not pressuring every customer.
3. Prompt Relevant Add-Ons From the POS Screen
Use POS prompts when sales history shows a repeatable product pairing. The prompt should appear after the cashier scans the main item, while the customer still decides. It works best for complements that require little explanation, such as fries, batteries, sauces, or warranties.
Log the prompt and the accepted add-on in the same transaction. Review the result in the POS report and compare attach rate, average ticket size, and average transaction value. A verbal suggestion leaves little evidence, while a logged prompt shows which pairing deserves wider use.
Set prompts only for relevant products. Too many recommendations slow the cashier and reduce trust in the screen. Start with a few high-confidence pairings, then remove prompts that rarely convert or create customer confusion.
4. Set Reachable Threshold Rewards
Threshold rewards work when many customers sit just below a reachable spend level. A small discount, free add-on, or delivery benefit should reward incremental spending rather than subsidize planned purchases. Set the threshold slightly above your current average transaction value so a ₱200 baseline has a realistic next step.
Keep the offer simple enough for cashiers to explain in one sentence, since complicated rules create counter hesitation and unclear results. Test by comparing ATV, transaction count, redemption rate, and contribution margin. Review the average transaction value formula first, keeping the sales basis, transaction definition, and VAT treatment unchanged.
5. Reject Tactics That Drive Customers Away
Reject any tactic that raises average transaction value by removing small buyers. Raising a minimum order can produce this illusion. Bundling unwanted items can create the same outcome. ATV rises because low-value transactions disappear, not because customers buy more value.
Watch transaction volume beside the average. If ATV rises from ₱200 to ₱220 while visits fall, compute total sales: complaints, abandoned baskets, and refunds are early warnings. A tactic earns a place in your retail sales tactics guide only when it lifts value without damaging demand, trust, or speed.
Proving the Lift Actually Held
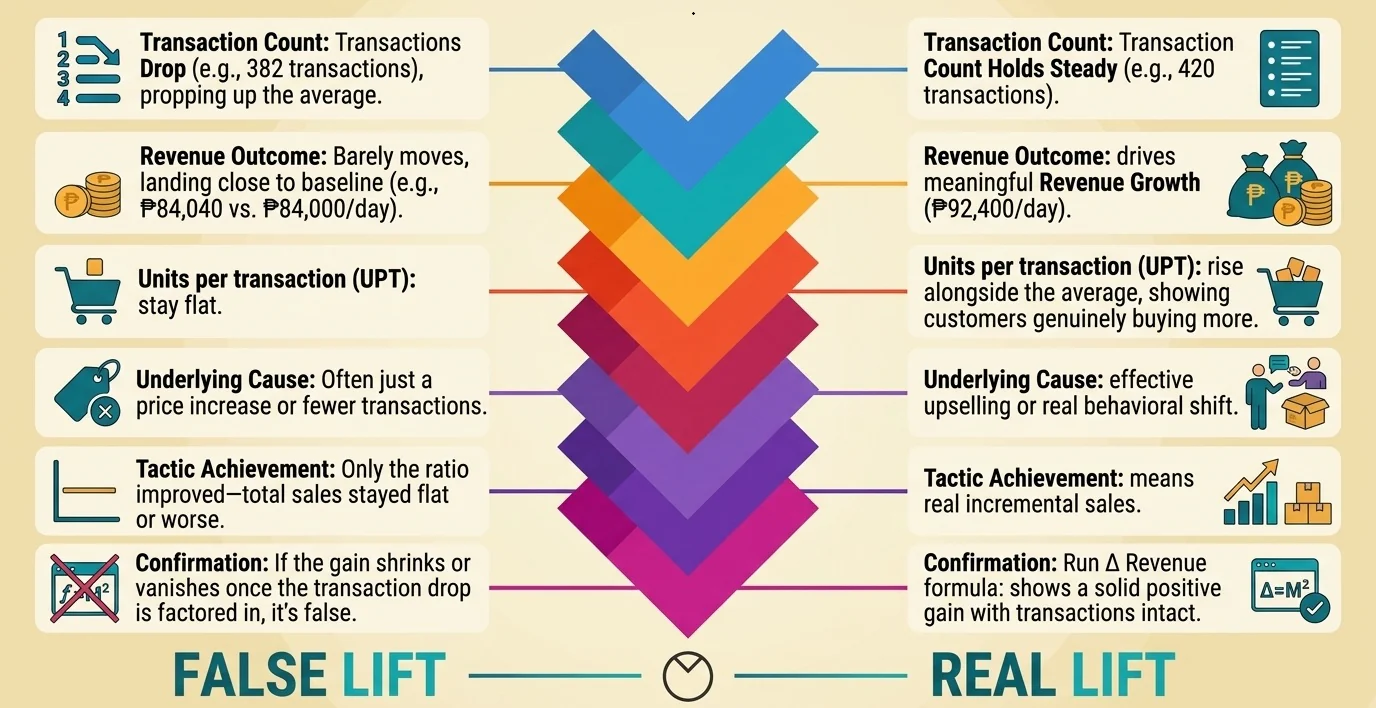
Most articles stop at the tactic list. A number that moved is not proof that anything worked. Before you report a win, confirm that the average transaction value rose for the right reason and that your transaction count survived the change.
Setting a Before-and-After Window
Compare like with like. Take four weeks before against four weeks after, matched by day of the week. Keep promotional periods and holidays off both sides, not just one, so the comparison stays clean.
Write the window down before you start measuring. A window chosen after you see the result will always flatter the tactic. Lock the dates, then read the average transaction value inside them.
Separating a Real Lift from a Price Increase
If prices rose ten percent and the average rose ten percent, no upselling happened. The same basket simply costs more. Check units per transaction to separate the two causes before you credit any counter tactic.
A rising average with rising units means customers buy more items. A rising average with flat units means pricing moved, which is a legitimate business decision but not an upsell result. Margin effects belong with your cost of goods sold review.
Watching Transaction Count for a Drop
The decisive test is whether transactions held. Run both scenarios against the same baseline of ₱200 across 420 transactions, which gives ₱84,000 per day. A real lift keeps the volume. A false lift trades volume for a better-looking ratio.
Real lift: ₱220 × 420 transactions = ₱92,400 per day
False lift: ₱220 × 382 transactions = ₱84,040 per day, against a ₱84,000 baseline
A ten percent rise in the headline average produced ₱40 of extra sales. If average transaction value rises ten percent while transactions fall ten percent, total sales stay flat, and the tactic failed. Only the ratio improved.
Δ Monthly Revenue = (New ATV − Old ATV) × Transactions per Day × Trading Days
(₱220 − ₱200) × 420 × 30 = +₱252,000
Applicable only if the number of transactions does not decrease.
A Weekly ATV Review That Takes Ten Minutes
Make this a short recurring habit instead of a quarterly project. Once a week, check the average transaction value, the transaction count, units per transaction, and the void and refund count, in that order.
Four numbers, ten minutes. That is enough to catch a distortion while staff still remember the shift it came from. A POS system that reports value and volume side by side produces this comparison at close of day instead of a monthly spreadsheet rebuild.
Once the check takes longer than the decision it supports, the review stops happening. HashMicro's POS software reports average transaction value, transaction count, and void activity on the same screen, so multi-branch retailers and food service operators can confirm a lift the same day it appears.

Getting ATV Out of Your POS Automatically
The computation is simple enough to do by hand, so capability is not the question. What matters is how often you need average transaction value and how many places you need it from. A POS report that produces it on a schedule removes the weekly rebuild.
1. What the System Should Count for You
The system should count completed tickets, not people. It should report average transaction value per branch, per shift, and per cashier, already cleaned of voids, refunds, and training tickets. It should state the VAT basis and apply one split bill rule everywhere.
Labels matter less than the computation behind them. Whether the dashboard says average basket size or average ticket size, the divisor must hold the same definition across every branch you plan to compare.
2. When Manual Counting Is Still Enough
Here is the honest objection. For a single counter running fifty transactions a day, computing the average manually once a week is enough. You already know how to calculate average transaction value, and a weekly check catches distortions early.
The switching point is not company size. It arrives when you run several branches and need to compare cashiers and shifts on the same basis. At that point manual comparison takes longer than the decision it supports.
3. Connecting ATV to Inventory and Purchasing
The average becomes more useful when you read it next to stock movement. A rising average driven by bundles changes which items move together, which changes what you reorder next cycle.
Linking counter data to your inventory management system closes that loop. A tactic that works at the register should not create a stockout two weeks later.
4. Four Closed Questions for Your POS Vendor
Ask these four before you accept any reported average. Each one has a yes or no answer, so a vendor who hedges is telling you something.
- Is average transaction value already cleaned of voids and refunds?
- Can it be split per cashier and per shift?
- Is a split bill counted as one transaction or several?
- Is the reported basis VAT inclusive or VAT exclusive?
If a vendor cannot answer all four clearly, the number in their dashboard is not yet comparable across your branches. HashMicro's POS system reports sales value, transaction count, and payment method together, so the average transaction value formula and the volume behind it stay visible in the same view.
Conclusion
Average transaction value is one of the easiest metrics to compute and one of the easiest to misread. Voided tickets, split bills, discount basis, and an unclear VAT setting each move the number without a single customer changing behavior. Clean the count before you launch any upselling program.
Once the number is clean, build a baseline from your own counter instead of borrowing a benchmark you cannot reconcile. Check the distribution before you pick a tactic, because a ₱200 average can hide ₱80 lunch tickets and ₱600 weekend tickets that need different offers.
Then prove the lift held. On a baseline of ₱84,000 across 420 transactions, a real lift gives ₱220 × 420 = ₱92,400 a day. A false lift gives ₱220 × 382 = ₱84,040, which is flat. Transaction count decides which one you have.
Before you trust any dashboard, ask your vendor about the voids cleaned, cashier and shift breakdown, split bill counting, and VAT basis. If you want that setup reviewed against your own branches and shift patterns, book a free consultation with HashMicro's team to test its system.

FAQ About Average Transaction Value
There is no universal figure, and no verifiable benchmark exists for the Philippine market by industry. Build a baseline from your own counter using the last eight to twelve weeks, separating weekdays from weekends and excluding promotional periods. Measure every target against that baseline.
Take gross sales for a fixed period and divide by completed transactions in that same period. Use gross sales rather than net bank deposits, and exclude voided, refunded, and training tickets from the count. For example, ₱84,000 across 420 completed transactions gives ₱200.00.
No. Average order value is an ecommerce metric computed per online order, while average transaction value is computed per transaction at a physical counter where one customer may return several times a day. The tactics that raise each metric are different.
That depends on how your POS reports sales. If the report is VAT inclusive, dividing by 1.12 gives the VAT exclusive equivalent, so ₱200.00 becomes ₱178.57. Confirm which basis your report uses before comparing branches or setting targets.
Usually because the transaction count grew faster than sales. Split bills, voided tickets left in the count, and a shift towards smaller baskets all raise the divisor. Check the count and the void report before assuming customers started spending less.
Weekly is enough for most counters. Review the average, the transaction count, units per transaction, and the void and refund count together. Monthly checks still work for a single low volume counter, but weekly catches distortions while staff can still explain the shift.