










 Limited to 100 registrants

POS data is the transaction and operational information recorded when a sale, payment, discount, return, refund, or other point-of-sale event occurs. When this data is accurate, connected, and consistently interpreted, it gives leaders a clearer view of what is happening across the business.
For multi-outlet retail and F&B enterprises, the challenge is keeping this data consistent across branches, payment channels, inventory systems, promotions, and finance records. Differences in product codes, reporting rules, or synchronization can produce conflicting totals, unreliable performance comparisons, inaccurate stock levels, and delayed financial reconciliation.
This article explains what POS data is, how it is collected, which metrics matter, and how daily sales reporting helps measure performance changes. You will learn how to organize dependable multi-location reporting, connect operational and financial information, and make better decisions across outlets, products, inventory, promotions, and payments.
Key Takeaways
POS data records transactions, sales data summarizes results, and POS reports guide specific business decisions.
Choose POS metrics by decision area, then compare consistent data to identify actionable performance variances.
Standardize POS definitions, connect systems, and strengthen controls to ensure accurate, traceable, decision-ready reporting.
What Is POS Data?
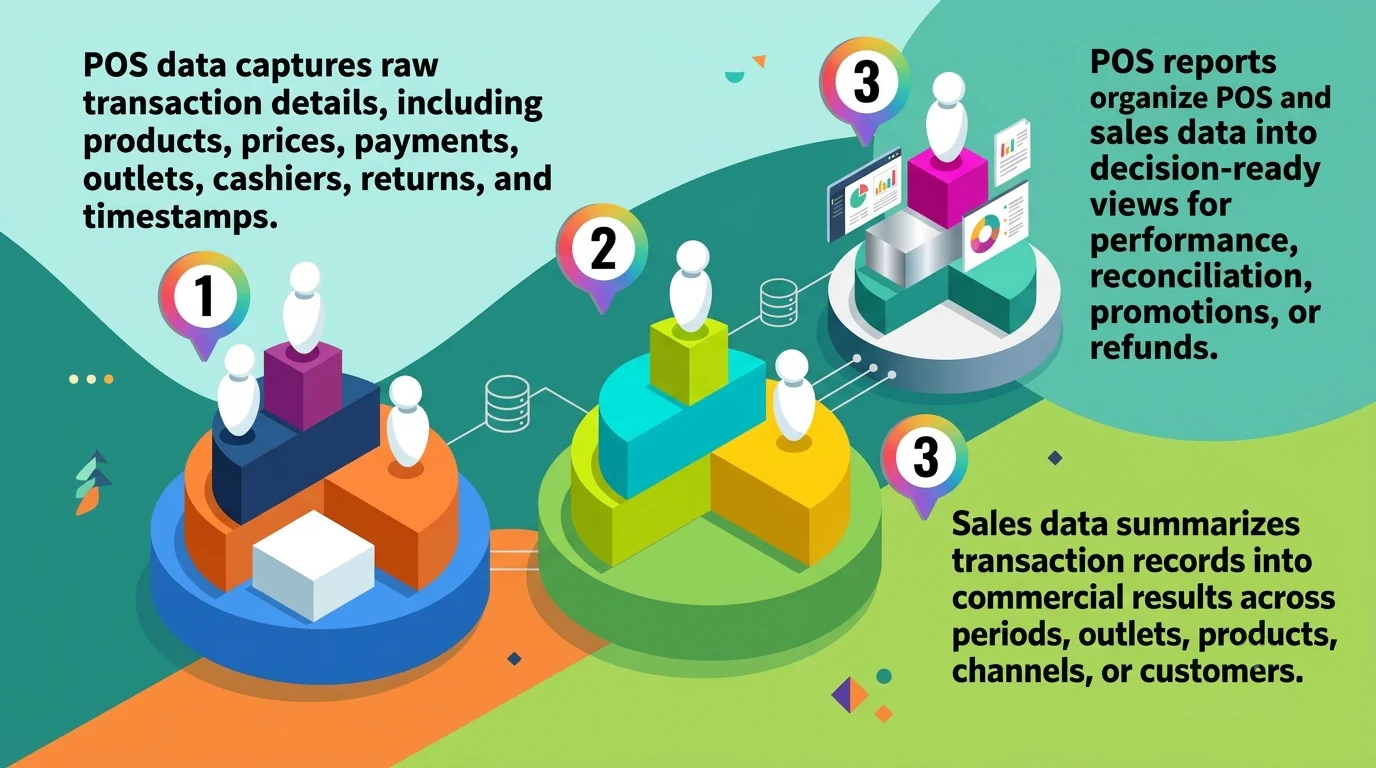
POS data, also called point of sale data, is the detailed information created whenever a store or restaurant processes a sale, payment, discount, return, refund, or void. Beyond recording totals, it connects frontline activity with inventory, finance, and management decisions across multi-outlet Philippine enterprises. For finance leaders, each record should show more than the final sales amount.
Common fields include:
- Transaction or receipt identifier
- Product or SKU
- Quantity sold
- Selling price and tax
- Discount amount or promotion applied
- Payment or tender type
- Transaction date and time
- Outlet, terminal, or sales channel
- Cashier, user, or shift identifier
- Transaction status, including completed, voided, refunded, or cancelled
POS data becomes a layered decision when connected to inventory, accounting, CRM, e-commerce, and ERP systems. It helps retail groups and restaurant chains evaluate stock availability, reconcile financial records, monitor promotions, compare outlet performance, and respond to operational issues. To understand how these records are captured, see how a POS system works.
POS Data vs. Sales Data vs. POS Reports
It is important to distinguish POS data, sales data, and POS reports. This is to prevent teams from treating raw transactions, summarized results, and decision-ready views as interchangeable despite their huge differences. This distinction is important as finance, operations, and commercial leaders can make a fatal mistake without a well-structured sales report.
| Type | What It Represents | Example or Purpose |
|---|---|---|
| POS data | Raw transaction events and attributes captured by the POS system. | Product, quantity, price, discount, payment type, outlet, cashier, timestamp, return, or refund. |
| Sales data | Commercial results summarized from relevant transaction records. | Net sales by day, outlet, product, category, channel, or customer segment. |
| POS reports | Organized views of POS and sales data created for a specific decision. | Daily outlet performance, payment reconciliation, promotion analysis, product mix, or refund monitoring. |
The Data Model Behind Reliable POS Reporting

Reliable POS reporting depends on how transaction records are structured, enriched, connected, and controlled. A sound data model supports reliable POS integration by preserving each sales event at the transaction level, linking it to consistent business definitions, and maintaining the context needed to reconcile payments, compare outlets, monitor inventory, and investigate exceptions.
How POS Records Become Decision-Ready Data
Each transaction should have a unique identifier and record the item, quantity, price, payment method, timestamp, outlet, terminal, and responsible user or shift. Returns, refunds, voids, cancellations, discounts, and price overrides should remain separate, traceable events linked to the original sale.
The record becomes more useful when connected to standardized product, pricing, promotion, outlet, staff, customer, inventory, payment, and accounting data. A connected POS inventory allows businesses to compare sales with stock movements, while accounting, CRM, e-commerce, payment, and ERP integrations add settlement, cost, and campaign context.
Before this information reaches management reports, businesses should standardize codes, detect incomplete or duplicate records, reconcile tenders, restrict access, document approvals, and preserve adjustment histories. These controls prevent precise-looking dashboards from producing misleading conclusions based on inconsistent definitions or untraceable changes.
Which POS Data Layers Support Each Decision?
Rather than treating POS information as a long list of unrelated data types, businesses can organize it according to the decisions each layer supports.
| Data layer | Typical fields | Decision supported |
|---|---|---|
| Transaction and payment | Net sales, discounts, returns, taxes, payment method | Revenue monitoring and payment reconciliation |
| Product and inventory | SKU, quantity, category, stock movement, stock-out status | Replenishment, pricing, and assortment decisions |
| Outlet and time | Branch, terminal, channel, date, daypart, shift | Location performance, staffing, and trading analysis |
| Customer and promotion | Loyalty identifier, campaign, voucher, basket value | Promotion effectiveness and customer retention |
| Control and audit | Cashier, void reason, refund approval, adjustment log | Exception monitoring, accountability, and fraud control |
Available fields vary by POS implementation, industry, configuration, and connected systems. The 2026 Verizon Data Breach Investigations Report recorded 997 retail security incidents, including 806 with confirmed data disclosure. Customer, employee, loyalty, and payment information may contain personal or sensitive data, so businesses should apply appropriate access controls, retention rules, and privacy safeguards.
The POS Metric Scorecard: Formulas, Meaning, and Next Actions
Metrics are most useful when they are not viewed in isolation. A number should help a team understand what changed, why it may have changed, and what to investigate next.
| Metric | Formula | What It Indicates | Interpretation and Likely Action |
|---|---|---|---|
| Net sales | Gross sales − discounts/comps − returns/refunds | Revenue after sales-related deductions | Rising gross sales can still produce weaker net sales when discounts or refunds increase. Review promotion rules, return reasons, and product-quality signals. Exclude taxes, tips, and payment fees from gross sales. |
| Sales growth | ((Current-period net sales − prior-period net sales) ÷ prior-period net sales) × 100 | Period-over-period sales movement | Compare equivalent periods and like-for-like outlets. Separate new-store growth from existing-store performance. Report “N/A” when prior-period sales are zero. |
| Average transaction value (ATV) | Net sales ÷ completed sales transactions | Average customer spending per completed sale | A lower ATV may reflect a weaker product mix, fewer add-ons, or heavier discounting. Exclude voided, cancelled, and return-only transactions. |
| Units per transaction (UPT) | Net units sold ÷ completed sales transactions | Average basket depth | If ATV rises while UPT falls, price increases or product mix may be driving performance rather than stronger basket-building. Apply returns consistently when calculating net units. |
| Discount rate | Total discounts and comps ÷ gross sales × 100 | Reliance on price reductions | Assess alongside net sales, gross margin, and campaign objectives. A higher rate may be acceptable when it generates profitable incremental demand. |
| Return/refund rate | Choose one stated basis: refunded transactions ÷ completed sales transactions × 100; returned units ÷ units sold × 100; or refund value ÷ gross sales × 100 | Product, service, process, or fulfilment problems | Do not mix transaction, unit, and value bases. Segment the selected measure by SKU, outlet, channel, cashier, and reason code. |
| Void rate | Voided transactions ÷ (completed transactions + voided transactions) × 100 | Transaction exception and control activity | Unusual differences by branch, terminal, or shift may indicate training gaps, process weaknesses, or approval-control issues. Use a separate line-item formula when measuring item voids. |
| Payment variance | Expected settlement − actual settlement | Payment-reconciliation differences | Investigate unexplained variances by payment method, outlet, settlement date, and owner. Match the same settlement period and account consistently for fees, refunds, chargebacks, and timing differences. |
| Gross margin %* | (Net sales − cost of goods sold) ÷ net sales × 100 | Profitability after product costs | Review alongside discounts, returns, and product mix. COGS must correspond to the same products, outlets, and reporting period as net sales. |
| Sell-through rate* | Units sold ÷ units available for sale × 100 | How efficiently available inventory converts into sales | Low sell-through may indicate weak demand or excess stock. High sell-through combined with frequent stockouts may indicate insufficient replenishment. |
* Use margin and inventory metrics only when POS, inventory, and cost records are integrated and reliable. Units available for sale should include opening inventory plus receipts, adjusted for transfers, supplier returns, write-offs, and other stock movements.
Select POS Metrics by the Decision You Need to Make
Picking the right POS metrics depends on the decision you're planning to make. Commercial, inventory, and control questions require different measures, so teams should avoid relying on one dashboard number. Grouping POS metrics by business purpose helps leaders choose relevant comparisons, investigate meaningful variances, and turn transaction data into timely operational and financial action.
1. Commercial Performance
Commercial metrics explain how effectively sales activity produces revenue and profit. Net sales shows revenue after discounts and returns, while transaction volume indicates the number of completed purchases. Average order value reveals spending per transaction, while gross margin by product or category identifies where sales generate the strongest contribution after product costs.
Comparing these measures with a documented flexible pricing strategy helps teams determine whether price changes improve contribution without suppressing transaction volume.
Gross-margin reporting should only be used when POS sales and returns are matched with accurate cost-of-goods-sold data for the same products, outlets, and reporting period.
2. Availability and Assortment
Availability and assortment metrics help teams determine whether the right products are available in the right quantities. Sell-through rate measures how much available inventory was sold, while stock-out frequency identifies recurring availability gaps. Slow-moving-stock analysis highlights products requiring replenishment changes, transfers, markdowns, or discontinuation.
Return rate should be calculated using one consistent basis, such as returned units divided by units sold. Segmenting it by SKU, category, outlet, channel, and reason code can reveal product-quality, fulfilment, or assortment problems.
3. Store and Financial Control
Store and financial-control metrics show where sales occur and whether transactions are processed and settled correctly. First, compare sales by outlet, shift, and channel. Then review void and refund activity and reconcile expected settlements with actual settlements using the same period and treatment of fees, chargebacks, and timing differences.
| Decision area | Metric | Business question answered | Action enabled |
|---|---|---|---|
| Commercial performance | Net sales | How much revenue remains after discounts, returns, and refunds? | Review pricing, promotion rules, return causes, and revenue trends. |
| Commercial performance | Transaction volume | Is performance changing because more or fewer completed purchases occurred? | Adjust traffic-generation, conversion, operating-hour, or staffing plans. |
| Commercial performance | Average order value | How much does a customer spend per completed transaction? | Improve bundles, add-ons, pricing, upselling, and product mix. |
| Commercial performance | Gross margin by product or category | Which products generate profitable sales after product costs? | Refine pricing, promotions, purchasing, and assortment priorities. |
| Availability and assortment | Sell-through rate | How efficiently does available inventory convert into sales? | Increase replenishment for strong sellers or reduce commitments for weak sellers. |
| Availability and assortment | Stock-out frequency | Which products or outlets repeatedly become unavailable? | Adjust safety stock, reorder points, allocation, and supplier planning. |
| Availability and assortment | Slow-moving stock | Which items remain unsold beyond an appropriate category-specific period? | Transfer, bundle, mark down, return, or discontinue affected products. |
| Availability and assortment | Return rate | Which products generate an unusually high proportion of returned units? | Investigate quality, descriptions, fulfilment, sizing, or assortment fit. |
| Store and financial control | Sales by outlet, shift, and channel | Where and when is sales performance strongest or weakest? | Adjust staffing, operating schedules, inventory allocation, and local execution. |
| Store and financial control | Payment-method mix | How do customers divide payments among cash, cards, wallets, and other methods? | Plan cash handling, payment capacity, costs, and channel availability. |
| Store and financial control | Void rate | Where are transaction cancellations occurring unusually often? | Review cashier training, approval rules, terminal issues, and exception patterns. |
| Store and financial control | Refund rate | Which outlets, channels, or products generate excessive refunded transactions or value? | Investigate service, fulfilment, product, and control weaknesses using a consistently defined basis. |
| Store and financial control | Payment-reconciliation variance | Do expected settlements match the amounts actually received? | Investigate missing payments, fees, chargebacks, timing differences, and posting errors. |
Build a Reporting Rhythm for a Multi-Outlet Business
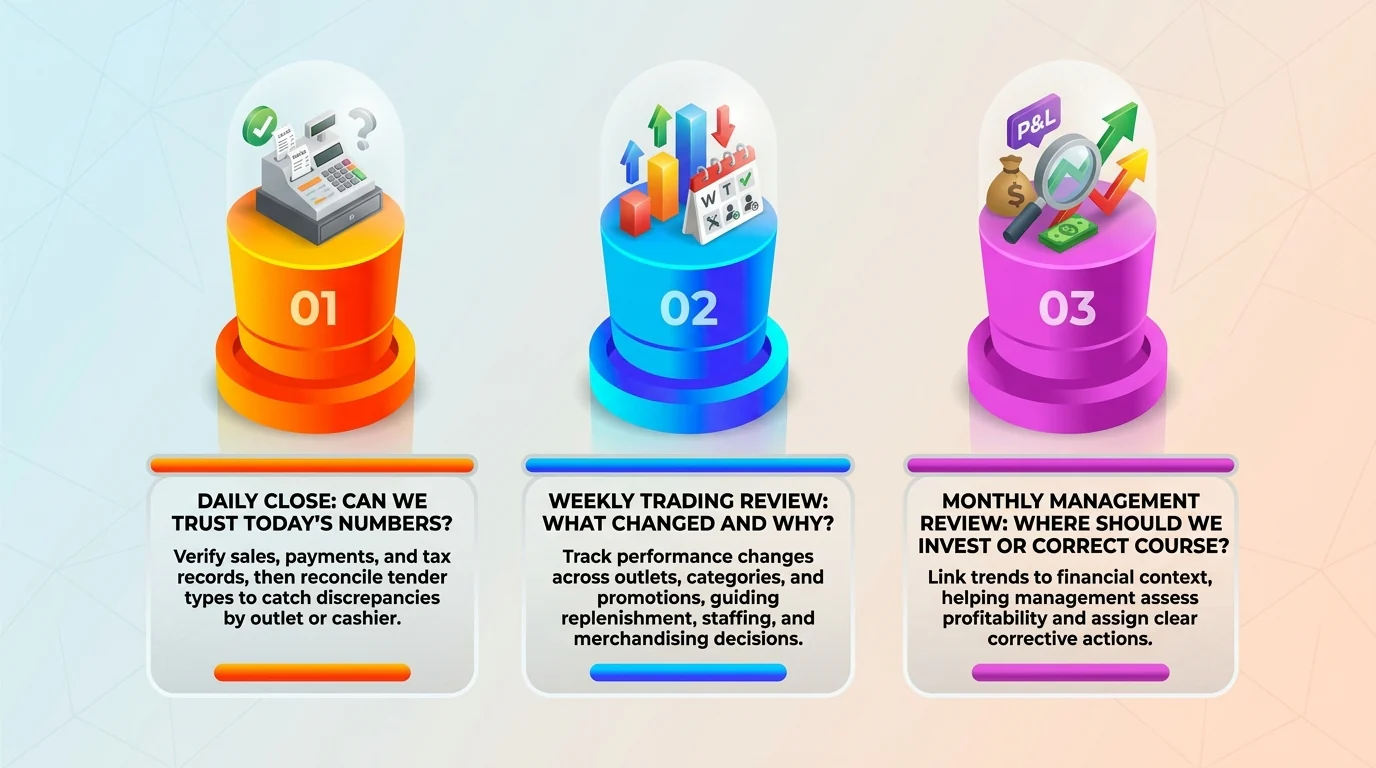
Structured POS reporting helps multi-outlet businesses match information to the decisions being made. Daily reviews confirm transaction accuracy, weekly reviews explain trading changes, and monthly reviews guide investment and corrective action. This cadence keeps teams focused on relevant exceptions without overwhelming them with disconnected dashboards or unnecessary reports.
1. Daily Close: Can We Trust Today’s Numbers?
A Daily POS sales report should verify that sales, payments, refunds, discounts, and tax records are complete and correctly classified. Teams should also match POS terminal records with POS tender totals before reconciling expected amounts against actual cash, card, wallet, and other payment records.
2. Weekly Trading Review: What Changed and Why?
A weekly POS sales report should explain meaningful changes in trading performance. Compare outlets, examine category movement and promotion results, review recurring void or refund exceptions, and identify stock-availability problems. These findings can guide replenishment priorities, product allocation, promotion execution, staff coaching, and local merchandising adjustments.
3. Monthly Management Review: Where Should We Invest or Correct Course?
A monthly POS sales report should connect longer-term trends with financial and operational context. Management can assess branch profitability, reconsider inventory allocation, identify pricing or bundling opportunities, and determine whether current POS systems for multi-branch operations can support further investment or expansion. The review should conclude with clear owners, corrective actions, and measurable follow-up priorities.
Turn POS Insight into Specific Business Actions
POS data becomes useful when teams connect each signal to a business question, an accountable owner, and a defined response. The following scenario shows how several measures can be evaluated together before managers change inventory, promotions, replenishment, or store operations.
Illustrative Scenario: Strong Weekend Demand but Frequent Stock-Outs
A retail group finds that one outlet generates strong weekend sales but repeatedly runs out of selected products. Sales alone cannot determine the correct response. Management should compare the outlet’s sell-through, stock availability, product-level profit margins, and promotion data for the same products and periods.
The combined analysis may show whether demand is genuinely strong, inventory allocation is insufficient, or promotions are accelerating low-margin sales without producing enough profit. Depending on the evidence, the business could:
- Transfer inventory from outlets with excess stock and lower demand.
- Adjust reorder points, safety stock, delivery frequency, or allocation rules.
- Redesign promotions that increase volume but weaken margin or availability.
- Change staffing, replenishment, or delivery schedules around weekend demand.
Before acting, teams should confirm that the apparent stock-outs are not caused by delayed stock updates, incorrect product records, unrecorded transfers, or other data-quality issues.
| Decision pattern | Question to investigate | Evidence to compare | Potential action |
|---|---|---|---|
| Inventory allocation | Is stock located where customer demand is strongest? | Sell-through, stock availability, stock coverage, transfers, and outlet demand | Reallocate inventory, revise replenishment parameters, or change delivery frequency. |
| Promotion ROI | Is the promotion producing profitable incremental demand? | Promoted sales, baseline sales, discount value, margin, returns, and stock-outs | Continue, redesign, limit, or discontinue the promotion. |
| Payment reconciliation | Do recorded tenders match the amounts expected and received? | POS tenders, settlements, refunds, fees, chargebacks, and timing differences | Investigate discrepancies, correct postings, and strengthen exception controls. |
| Outlet investigation before expansion | Is strong performance repeatable and operationally sustainable? | Sales trends, margin, availability, exceptions, staffing, and local demand | Correct operational weaknesses, test the model further, or proceed with expansion planning. |
This approach turns POS reporting into accountable action. Every identified signal should lead to a defined investigation, a responsible owner, a deadline, and a follow-up review to confirm whether the action improved the underlying result.
Where POS Reporting Commonly Breaks Down

POS reporting commonly breaks down when businesses combine point of sales data from outlets that use different definitions, systems, and controls. Even a centralized dashboard becomes unreliable when figures cannot be compared or traced to their source. Identifying these weaknesses helps multi-outlet teams improve reporting accuracy, reconciliation, accountability, and decision-making.
1. Inconsistent Definitions
Different SKU codes, outlet names, discount categories, and return labels prevent reliable comparisons. For example, one branch may record a returned item as a refund while another classifies it as a cancelled sale. Without standardized definitions and master data, the same example of POS data can produce different results across reports.
Businesses should apply master data management to establish shared product, outlet, channel, promotion, payment, and transaction-status definitions across locations. Each reported figure should also be traceable to its underlying transaction so teams can verify how it was classified and calculated.
2. Disconnected Systems
POS, inventory, accounting, CRM, and payment platforms may maintain separate versions of the same transaction. When teams consolidate these records through spreadsheets, reporting slows down, and the risk of missing transactions, duplicated entries, outdated stock balances, and unexplained payment differences increases.
A clear answer to “what is POS data?” must therefore cover more than the receipt. It should include the identifiers and statuses needed to connect sales, stock movements, customer activity, accounting entries, refunds, and payment settlements across systems.
3. Weak Controls
Undefined approval rules for voids, refunds, discounts, and price overrides weaken auditability. If users can alter transactions without documented authorization or traceable history, managers may struggle to distinguish legitimate corrections from training problems, policy exceptions, or control failures.
A stronger reporting environment should include:
- Standardized master data and reporting definitions
- Role-based access aligned with job responsibilities
- Approval workflows for sensitive transaction changes
- Audit trails showing who performed and approved each action
- Clear ownership for operational and management reports
- Scheduled reconciliation across sales, payments, inventory, and accounting
Retail and F&B operations may require different product structures, transaction flows, control rules, and approaches to analyzing retail foot traffic. These differences should be reflected in their reporting design while preserving consistent enterprise-level definitions.
Create a Single Source of Truth from POS to ERP
POS data is more than a record of completed sales. For enterprise retail and F&B businesses, it can support stronger financial control, better inventory allocation, more effective promotions, and clearer multi-location performance management when every transaction is captured accurately and interpreted within the correct operational context.
Its value depends on a disciplined chain:
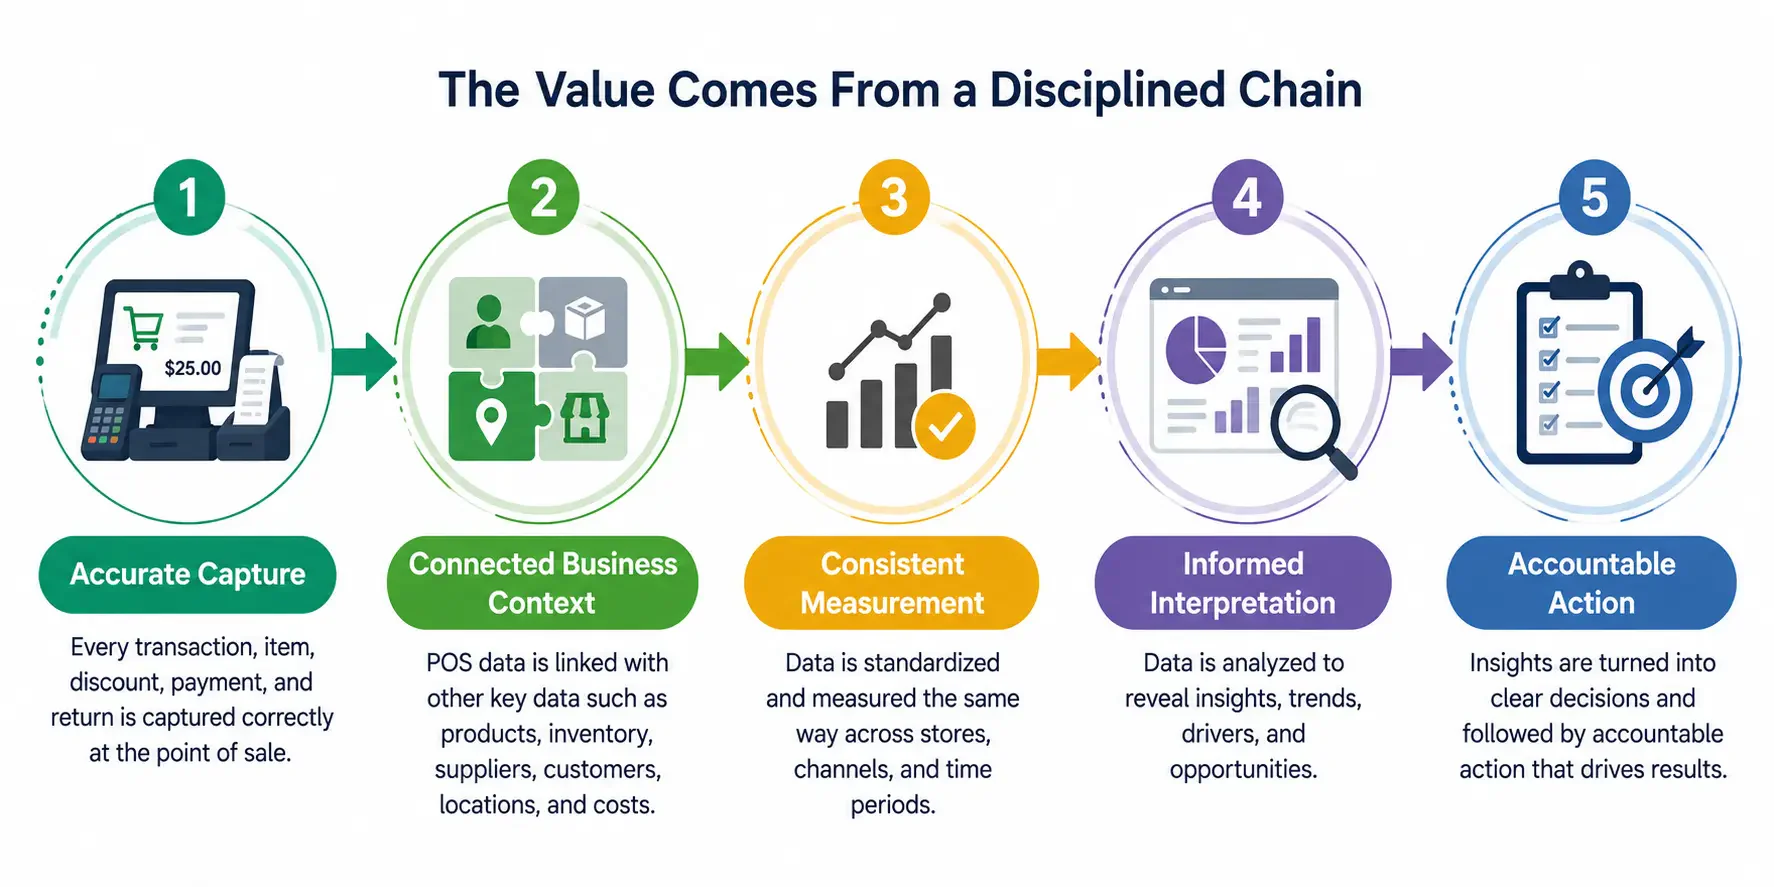
Integrating POS, inventory, accounting, CRM, and ERP systems can align sales records with stock movements, customer activity, payment settlements, and financial postings. Shared identifiers and standardized definitions make reporting more comparable across outlets while allowing summarized figures to be traced back to their underlying transactions.
Software such as HashMicro POS can validate the selected product, modules, integrations, and deployment scope. The validated data is connected to workflows that may help teams centralize reporting, reconcile transactions, trace records, oversee multiple locations, and make faster decisions across finance, inventory, promotions, outlets, and channels.

Conclusion
Standardized POS data gives every outlet, function, and report a consistent basis for measuring sales, inventory, promotions, payments, and exceptions. When teams capture transactions promptly and reconcile them with stock, settlement, and financial records, leaders can compare performance confidently, trace discrepancies, and address issues before they affect wider operations.
For multi-location retail and F&B enterprises, dependable POS data turns reporting from a record of past activity into a practical tool for financial control and growth decisions. An integrated POS system can further connect operational insights with accountable action across the business.
One such system is HashMicro’s POS software, which centralizes multi-outlet sales, inventory, payment, promotion, and customer data while connecting transactions with accounting and operational records. Its reporting and control capabilities help managers reconcile figures, monitor outlet performance, investigate exceptions, and coordinate follow-up actions from just one platform. A user can request a free consultation to discuss the features and price.

FAQ for POS Data
When businesses refer to "POS Data," they are referring to the transaction and operational information a point-of-sale system records when processing a sale, payment, discount, return, refund, or void. Common fields include products, quantities, prices, taxes, payment methods, timestamps, outlets, cashiers, and transaction statuses.
POS data contains raw transaction-level details, such as items, prices, discounts, tenders, outlets, and timestamps. Sales data summarizes selected transactions into commercial results, such as daily net sales by branch or category. POS reports organize either dataset into decision-focused views for reconciliation, inventory planning, promotion analysis, or performance monitoring.
For multi-outlet businesses, the most useful POS metrics include net sales, transaction volume, average transaction value, gross margin, sell-through, stock-out frequency, payment-method mix, void rate, refund rate, and payment variance. Leaders should compare equivalent periods, outlets, products, and definitions because no single metric or universal benchmark explains performance reliably.
POS data supports payment reconciliation by comparing expected tender amounts with actual cash, card, wallet, and other settlements. Teams can investigate differences by outlet, terminal, cashier, shift, payment method, and settlement date. Accurate analysis must apply consistent treatment to refunds, fees, chargebacks, posting errors, and timing differences.
Yes. Point of sales data can integrate with inventory, accounting, CRM, e-commerce, payment, and ERP software through supported modules or interfaces. This connection can align sales with stock movements, customer activity, settlements, costs, and financial postings. Businesses should validate compatibility, data mapping, synchronization, security, and implementation scope before deployment.