









 Limited to 100 registrants

A sales report is a structured document that tracks revenue, pipeline activity, and team performance over a defined period. For Australian businesses, it also feeds directly into BAS preparation and EOFY reporting requirements set by the ATO.
In this article, we cover every major sales report type, eight free templates, real examples for Australian retailers and multi-state businesses, and a six-step process for creating reports your leadership team will actually use.
Key Takeaways
Sales reports turn business data into clear insights for tracking performance and guiding decisions.
Ready-to-use sales report templates provide consistent formats for different reporting periods and business needs.
Creating an effective sales report starts with a clear goal, accurate data, the right format, and practical recommendations.

What Is a Sales Report?

A sales report is a document that tracks, analyses, and presents sales activity and performance over a specific period. It helps businesses track revenue, evaluate team performance, monitor progress toward targets, and support data-driven decision-making.
A sales report is a document or dashboard that summarises a company’s sales performance over a specific period. It usually includes key metrics such as revenue, deals closed, products sold, and customer trends.
By turning raw data into useful insights, a sales report helps businesses understand what is working and where improvements are needed. It can highlight missed opportunities, changing buying behaviour, and patterns that influence future growth.
Sales reports support every level of a business. Teams use them to track targets, managers use them to monitor pipelines and forecast results, while leaders rely on them for planning, budgeting, and smarter decision-making.
Why Sales Reports Matter for Australian Businesses
Australian businesses operate in a market shaped by wide geography, different state economies, and strict tax rules. Because of this, sales reports do more than track revenue, they support growth and compliance.
Regular sales reports help businesses compare revenue against targets and react quickly to changes. This is especially useful for industries with seasonal demand, such as retail, tourism, and agriculture, when monitoring sales performance.
They also make BAS and EOFY reporting easier by keeping accurate sales records. At the same time, reports help improve team performance and guide smarter business decisions.
"Sales reports give businesses a clear view of performance, helping teams track progress, spot opportunities, and make smarter decisions with confidence."
Types of Sales Reports
Different businesses need different sales reports depending on their goals, reporting period, and audience. Sales teams may focus on daily activity metrics, while managers and executives need broader insights into revenue trends, forecasts, and long-term performance.
| Report Type | Frequency | Primary Audience | Main Purpose |
|---|---|---|---|
| Daily sales report | Daily | Sales reps, team leads | Activity tracking and short-term progress |
| Weekly sales report | Weekly | Sales managers | Pipeline movement and weekly priorities |
| Monthly sales report | Monthly | Management | Revenue review and trend analysis |
| Quarterly sales report | Quarterly | Management, finance | BAS alignment and strategic review |
| Annual sales report | Yearly | Executives, finance | EOFY reporting and budgeting |
| Sales pipeline report | Ongoing | Sales managers | Forecast revenue and identify bottlenecks |
| Sales performance report | Monthly/quarterly | Managers, HR | Rep evaluation and coaching |
| Sales forecast report | Monthly/quarterly | Executives, finance | Plan inventory, staffing, and cash flow |
| Sales by product/category | Monthly/quarterly | Product, sales teams | Pricing strategy and inventory planning |
| Sales by region | Monthly/quarterly | Regional managers | Compare state performance across AU markets |
1. Daily sales report
Tracks daily sales activities such as calls made, meetings booked, deals closed, and revenue generated. It helps teams stay productive, measure short-term progress, and resolve issues quickly.
2. Weekly sales report
Summarises weekly performance, including new leads, follow-ups, closed deals, and pipeline movement. It is commonly used in weekly meetings to review progress and set priorities.
3. Monthly sales report
Provides a complete overview of monthly revenue, targets achieved, and team performance. It is useful for management reviews, commission calculations, and identifying sales trends.
4. Quarterly sales report
Measures performance over a three-month period and is often aligned with Australian BAS quarters. It supports compliance reporting, strategic reviews, and medium-term business planning.
5. Annual sales report
Summarises total sales performance across the financial year. It helps with EOFY reporting, budgeting decisions, and setting future sales targets.
6. Sales pipeline report
Shows all active sales opportunities by stage, from lead generation to final closing. It helps businesses forecast future revenue, identify bottlenecks in the sales process, and support automating sales management.
7. Sales performance report
Evaluates results by individual sales representative or team using KPIs such as revenue, quota attainment, and win rate. It supports coaching, accountability, and team improvement.
8. Sales forecast report
Sales forecasts use historical results, pipeline value, and market trends. Australian Government guidance on forecasting sales recommends reviewing prior years and seasonal patterns to support planning.
9. Sales by product / category report
Breaks down revenue by product or category to identify top-performing and slow-moving items. It supports pricing strategies, promotions, and inventory planning.
10. Sales by region report
Tracks sales performance by state or territory such as NSW, VIC, and QLD. It helps businesses compare regional demand and adjust strategies across Australian markets.
What to Include in a Sales Report
A useful sales report should focus on the data that supports clear decisions. Too little information limits insight, while too many metrics can make reports harder to use. The best reports present key figures first, followed by deeper details where needed.
1. Key sales metrics and KPIs
Every sales report should include core KPIs that measure performance and progress. Common examples include quota attainment, average deal size, win rate, and sales cycle length. These metrics give stakeholders a quick view of overall results.
2. An executive summary that answers three questions
A short executive summary at the top of any leadership-facing report gives decision-makers the result before they read a single table. It should answer three questions in three to five sentences: where did we land against target, what drove that result, and what should we do differently next period.
Keep the summary to a short paragraph, written in plain language so it can be forwarded directly to board members, investors, or senior stakeholders who may not have sales context. Everything below it in the report is supporting evidence for the summary, not the main message.
3. Revenue, volume, and conversion data
Reports should clearly show total revenue, number of sales, and conversion rates across the pipeline. This is essential for tracking sales pipeline progress and identifying opportunities at each stage.
Businesses in Australia may also track GST-inclusive and GST-exclusive revenue separately for accurate reporting.
4. Period comparisons and trend analysis
Current results are more meaningful when compared with past performance. Month-on-month, year-on-year, or quarterly comparisons help identify growth patterns, seasonal changes, and performance trends over time.
5. Goals vs actuals and next steps
A strong report compares targets with actual results to measure success. It should also include short explanations, recommended actions, or next steps to improve future sales performance.
6. New Customers
Tracking new customers helps businesses measure the effectiveness of their sales and lead generation efforts.
Sales reports should show how many new customers were acquired, the revenue they generated, and which regions or channels are contributing most to business growth.
7. Product Performance
A sales report should include performance by product or service line to show which offerings generate the most revenue and sales activity. Comparing results across different periods can help businesses identify top-performing products, improve sales strategies, and uncover upselling opportunities.
Why the Template Breaks First
A sales report template works until the data stops arriving on time. The report is only as good as what reps typed in last week, and chasing that input usually costs more than building the report itself.
Three things tend to go wrong before anyone blames the format.
- The numbers arrive late: By the time the sheet is complete, the week it describes has already gone.
- Every rep counts differently: One logs a deal at proposal, another at verbal yes, so the pipeline total means little.
- Nobody can check a figure: When a manager questions a number, tracing it back means asking the rep who typed it.
| Weekly Task | With a Template | With Sales Reporting Software |
|---|---|---|
| Collecting rep updates | Chased by email before every meeting | Captured as deals move through the pipeline |
| Building the report | Rebuilt by hand each cycle | Refreshed on its own |
| Checking a number | Ask whoever entered it | Open the deal behind the figure |
| Comparing reps or regions | Merge separate sheets | Filter one shared view |
The real saving is not a prettier report. It is the hours your sales manager spends assembling one instead of coaching the team.
Ready-to-Use Free Sales Report Templates
Using a ready-made template can save time and make sales reporting more consistent. The templates below cover common reporting needs, from daily activity tracking to long-term forecasting, and can be customised for different business sizes or industries.
1. Daily sales report template
Use this template to track daily sales activities, deals closed, revenue earned, and follow-ups completed. It is ideal for monitoring productivity and short-term progress.
TEMPLATE DAILY SALES REPORT

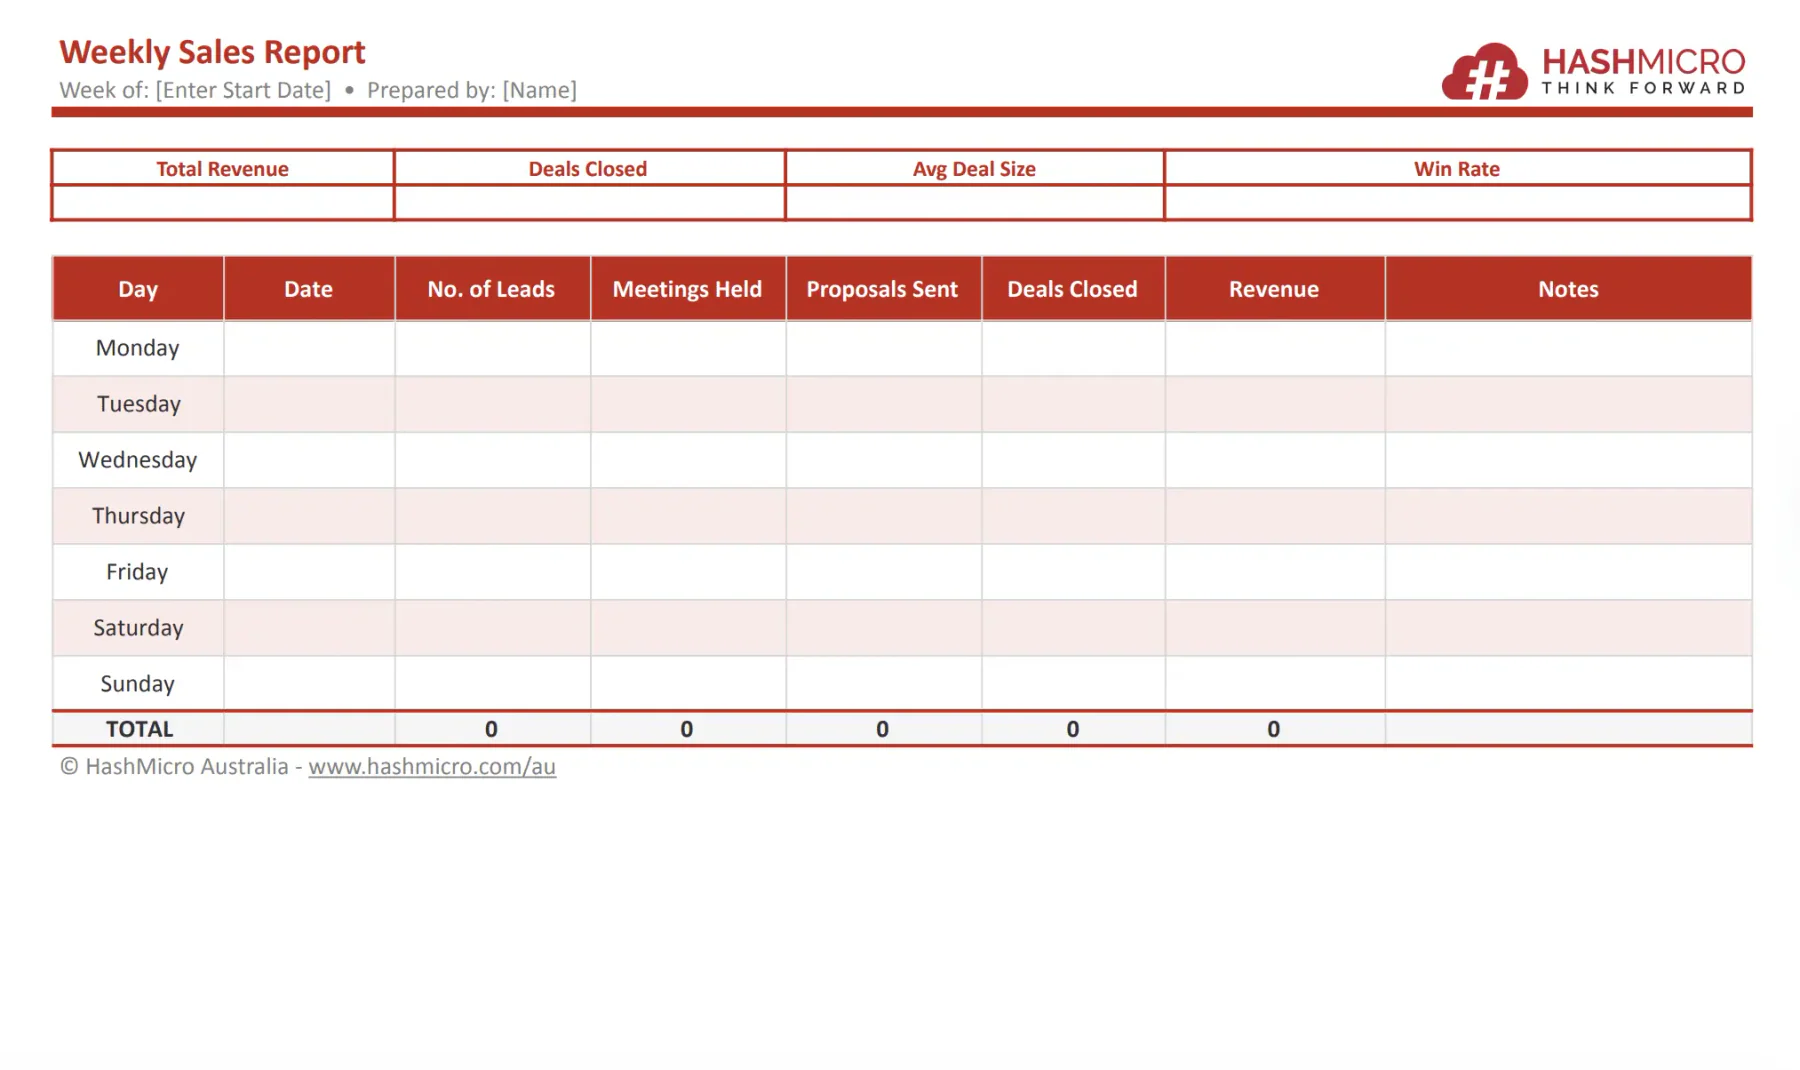
2. Weekly sales report template
This template summarises weekly sales performance and pipeline movement. It is commonly used during team review meetings to assess progress and priorities.
TEMPLATE WEEKLY SALES REPORT
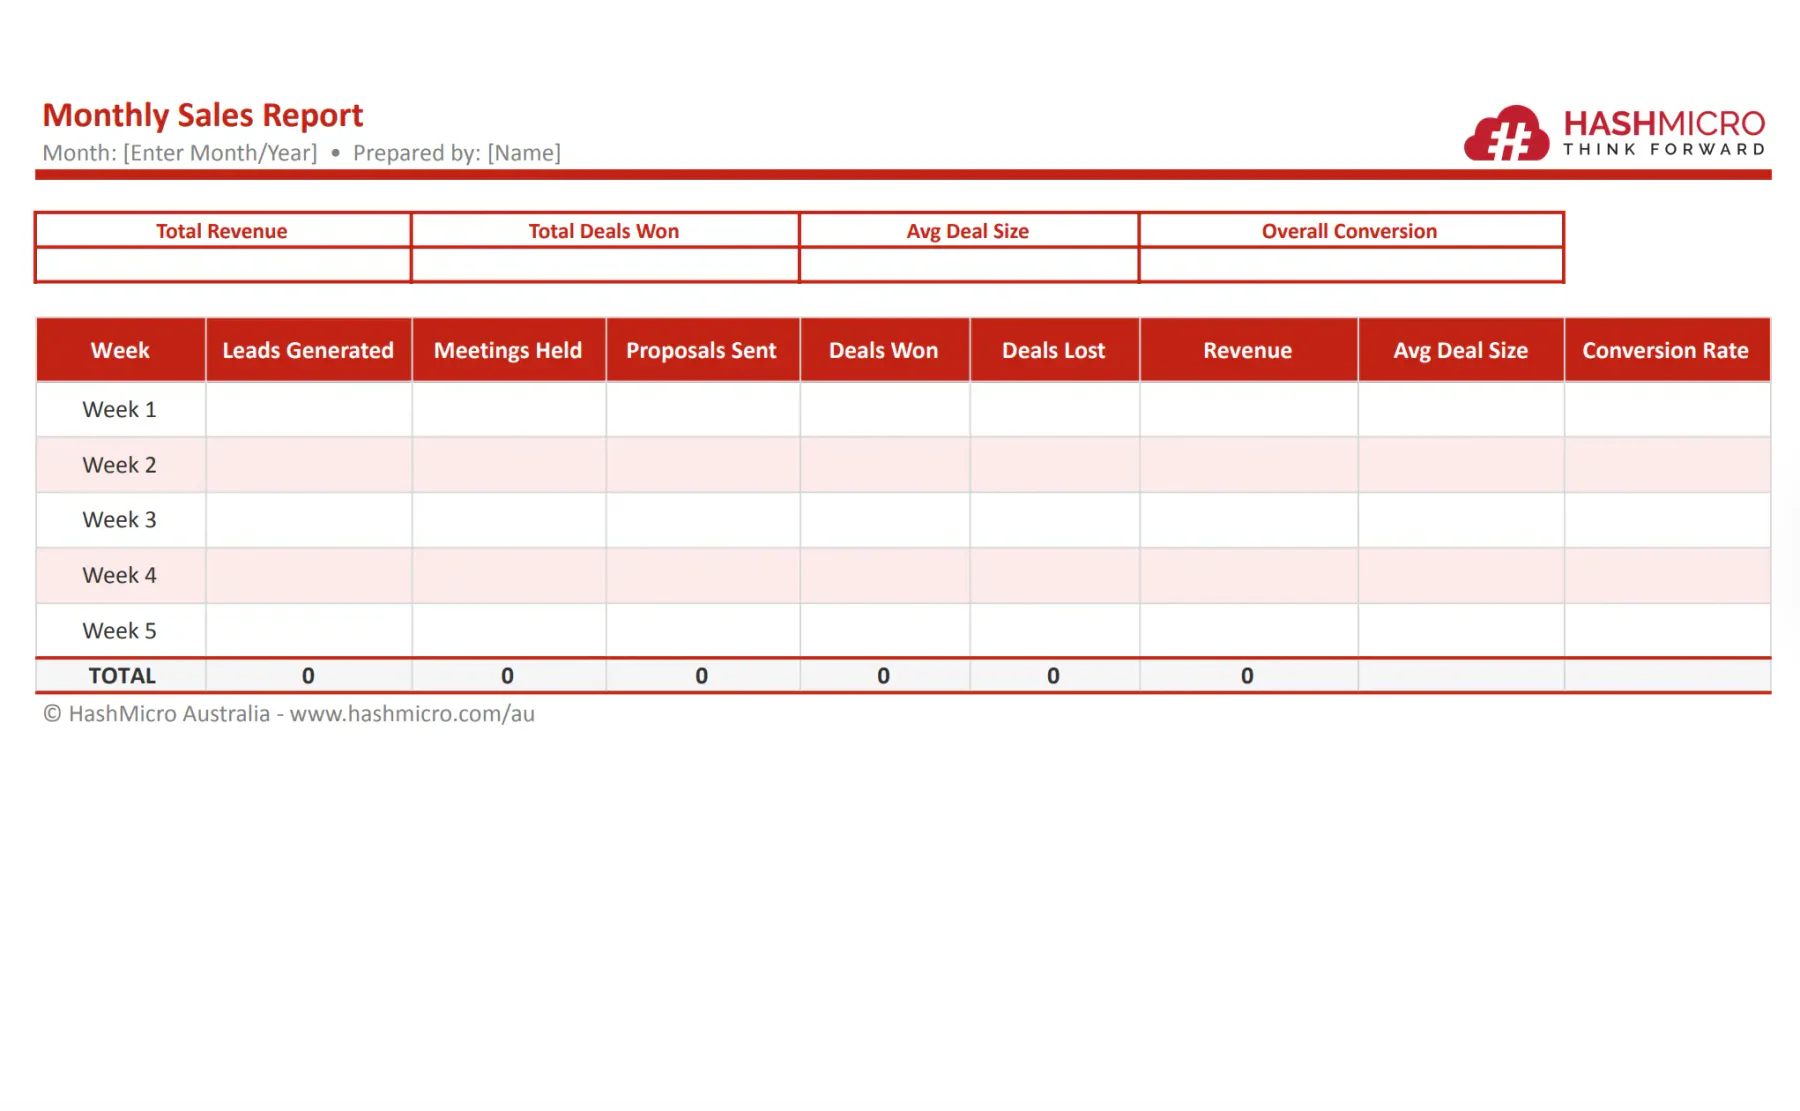
3. Monthly sales report template
A monthly template gives management a broader view of revenue, sales trends, and team performance. It is useful for commissions, budgeting, and monthly reviews.
TEMPLATE MONTHLY SALES REPORT
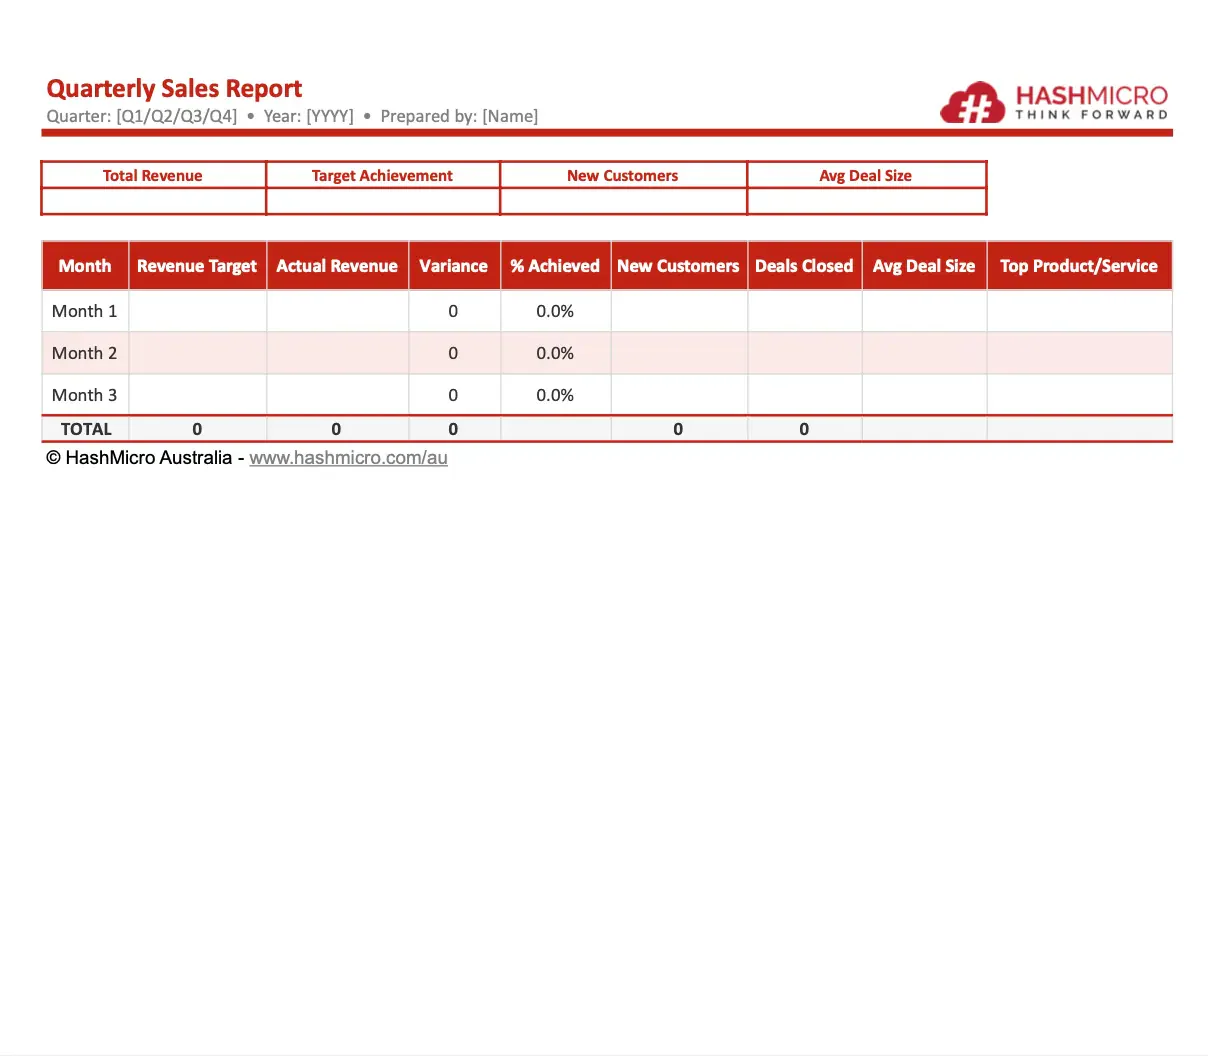
4. Quarterly sales report template
This template reviews performance over three months and is useful for strategic planning. Australian businesses often align quarterly reports with BAS reporting periods.
TEMPLATE QUARTERLY SALES REPORT
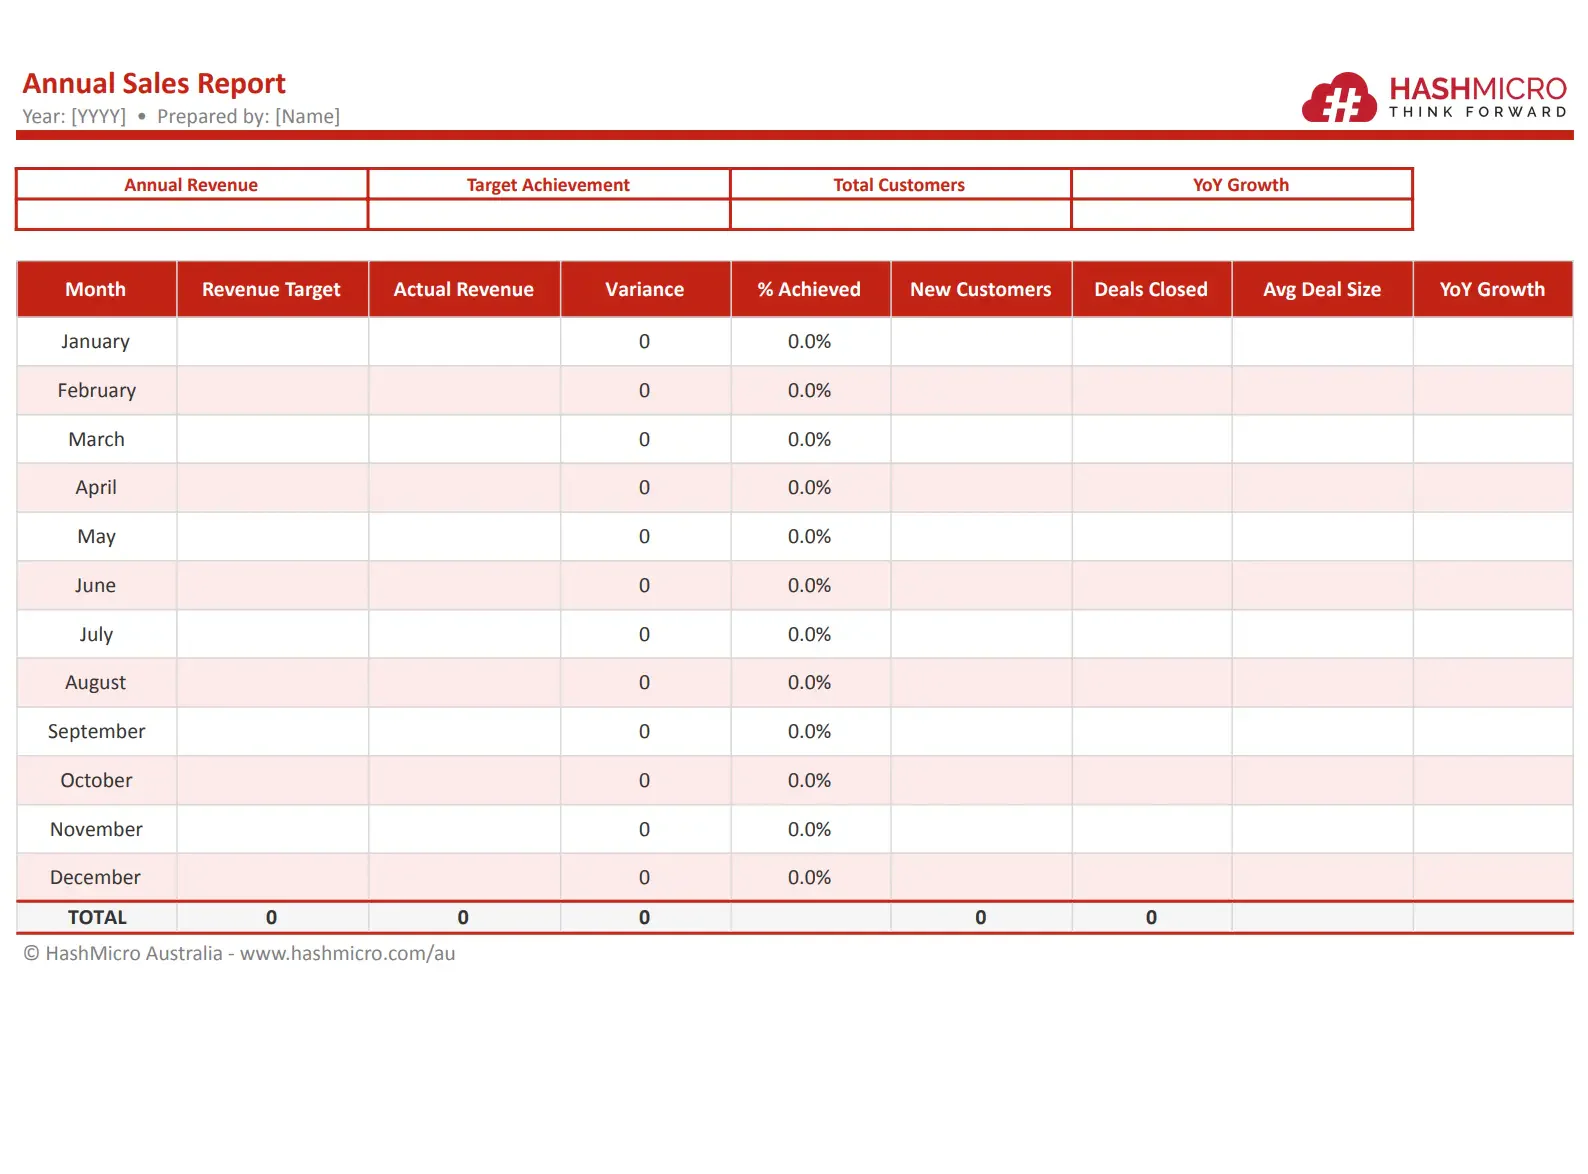
5. Annual sales report template
Use an annual template to summarise full-year sales results and prepare for future planning. It is especially useful during EOFY reviews.
TEMPLATE ANNUAL SALES REPORT
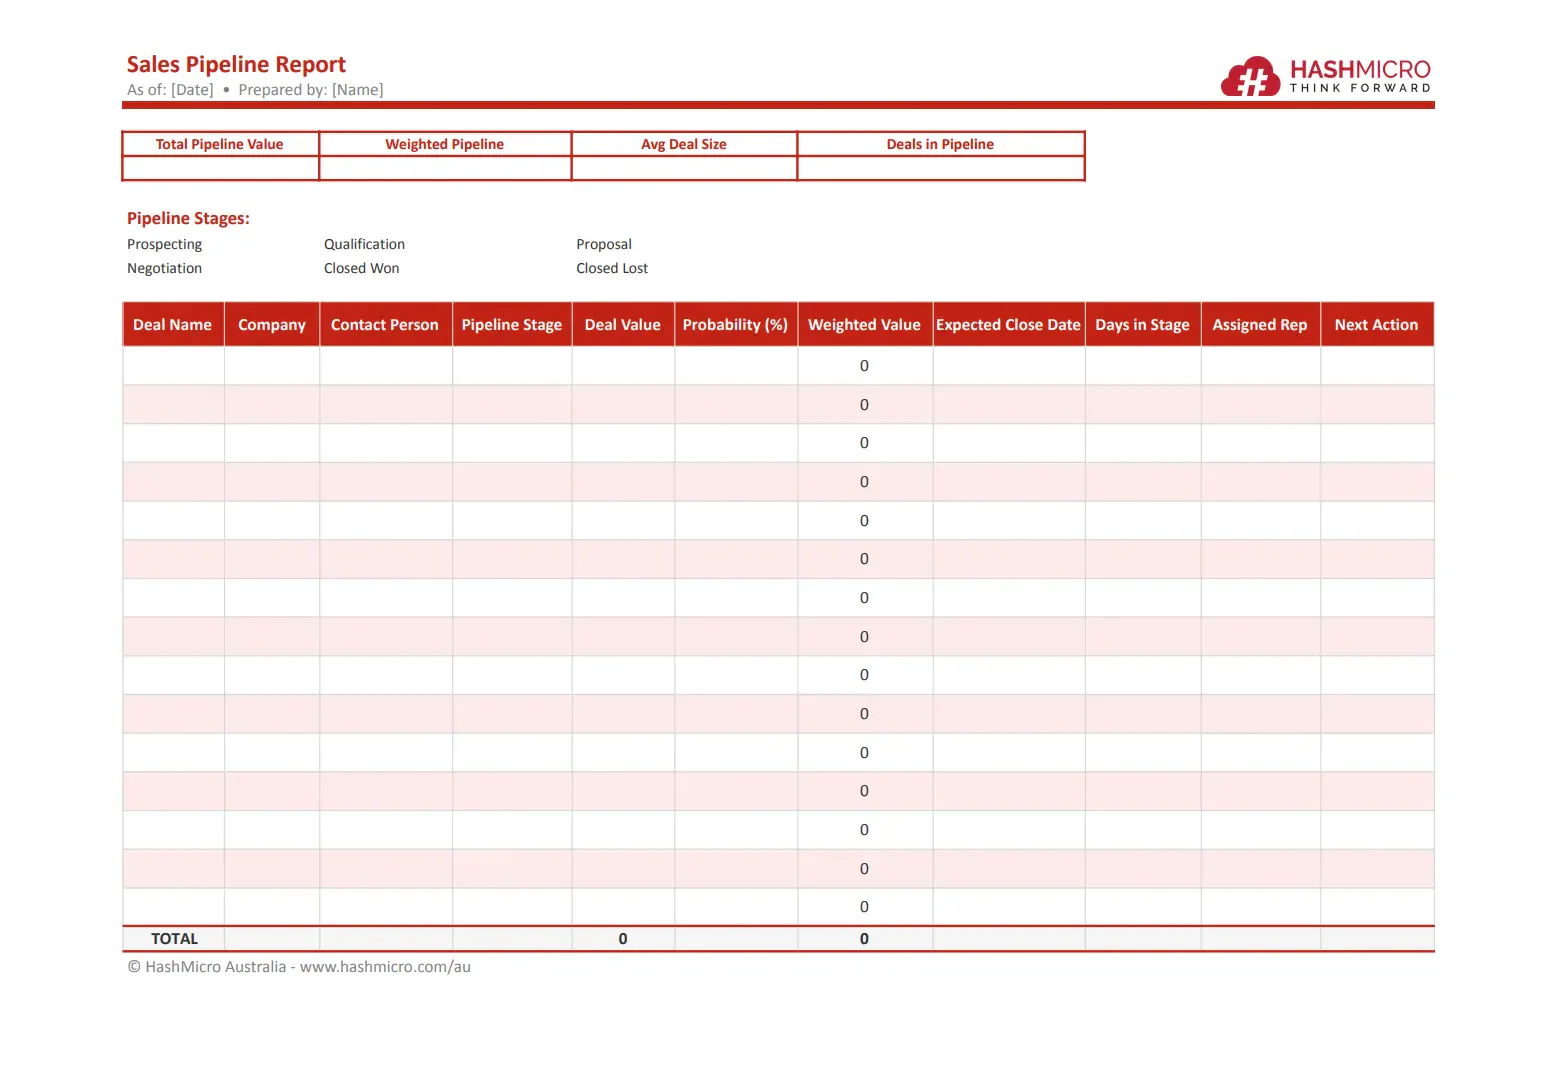
6. Sales pipeline report template
A pipeline template tracks active opportunities at each stage of the sales process. It helps forecast revenue and identify delays.
TEMPLATE SALES PIPELINE REPORT
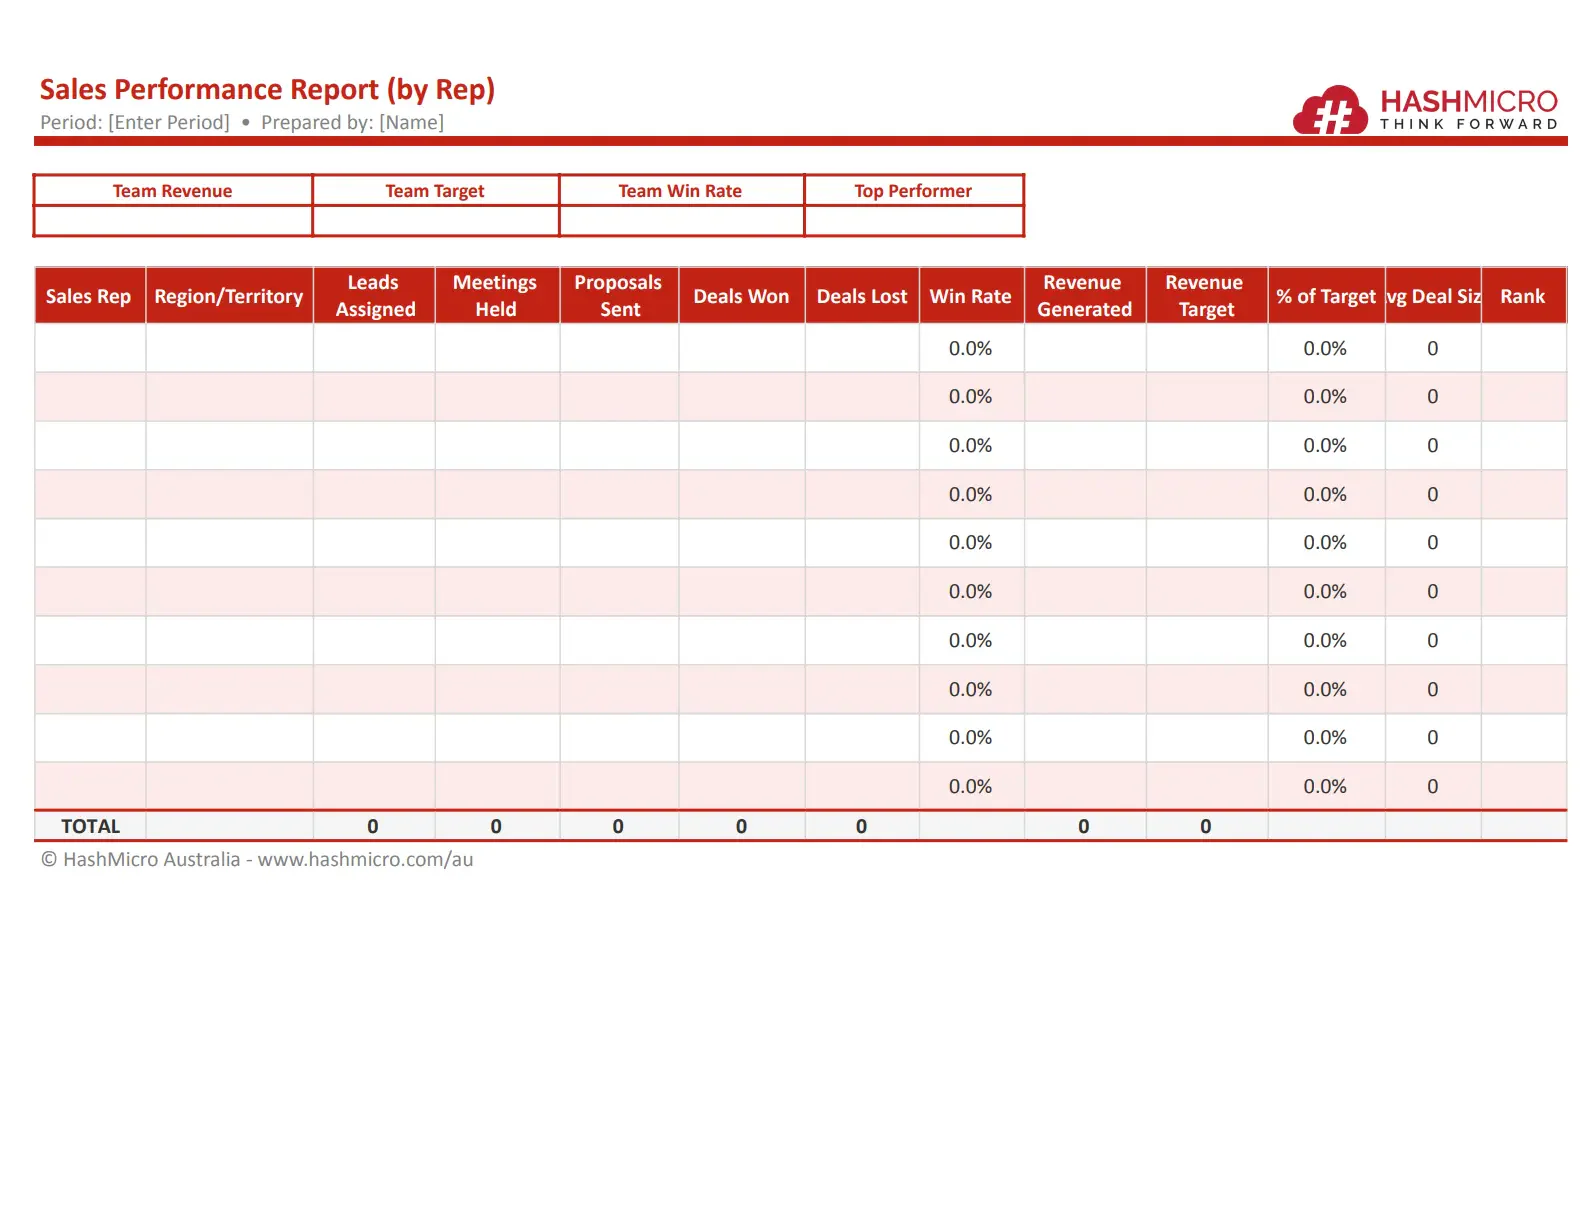
7. Sales performance report template (by Rep)
This template compares results by salesperson or team. It supports coaching, performance reviews, and incentive planning.
TEMPLATE SALES PERFORMANCE REPORT (BY REP)
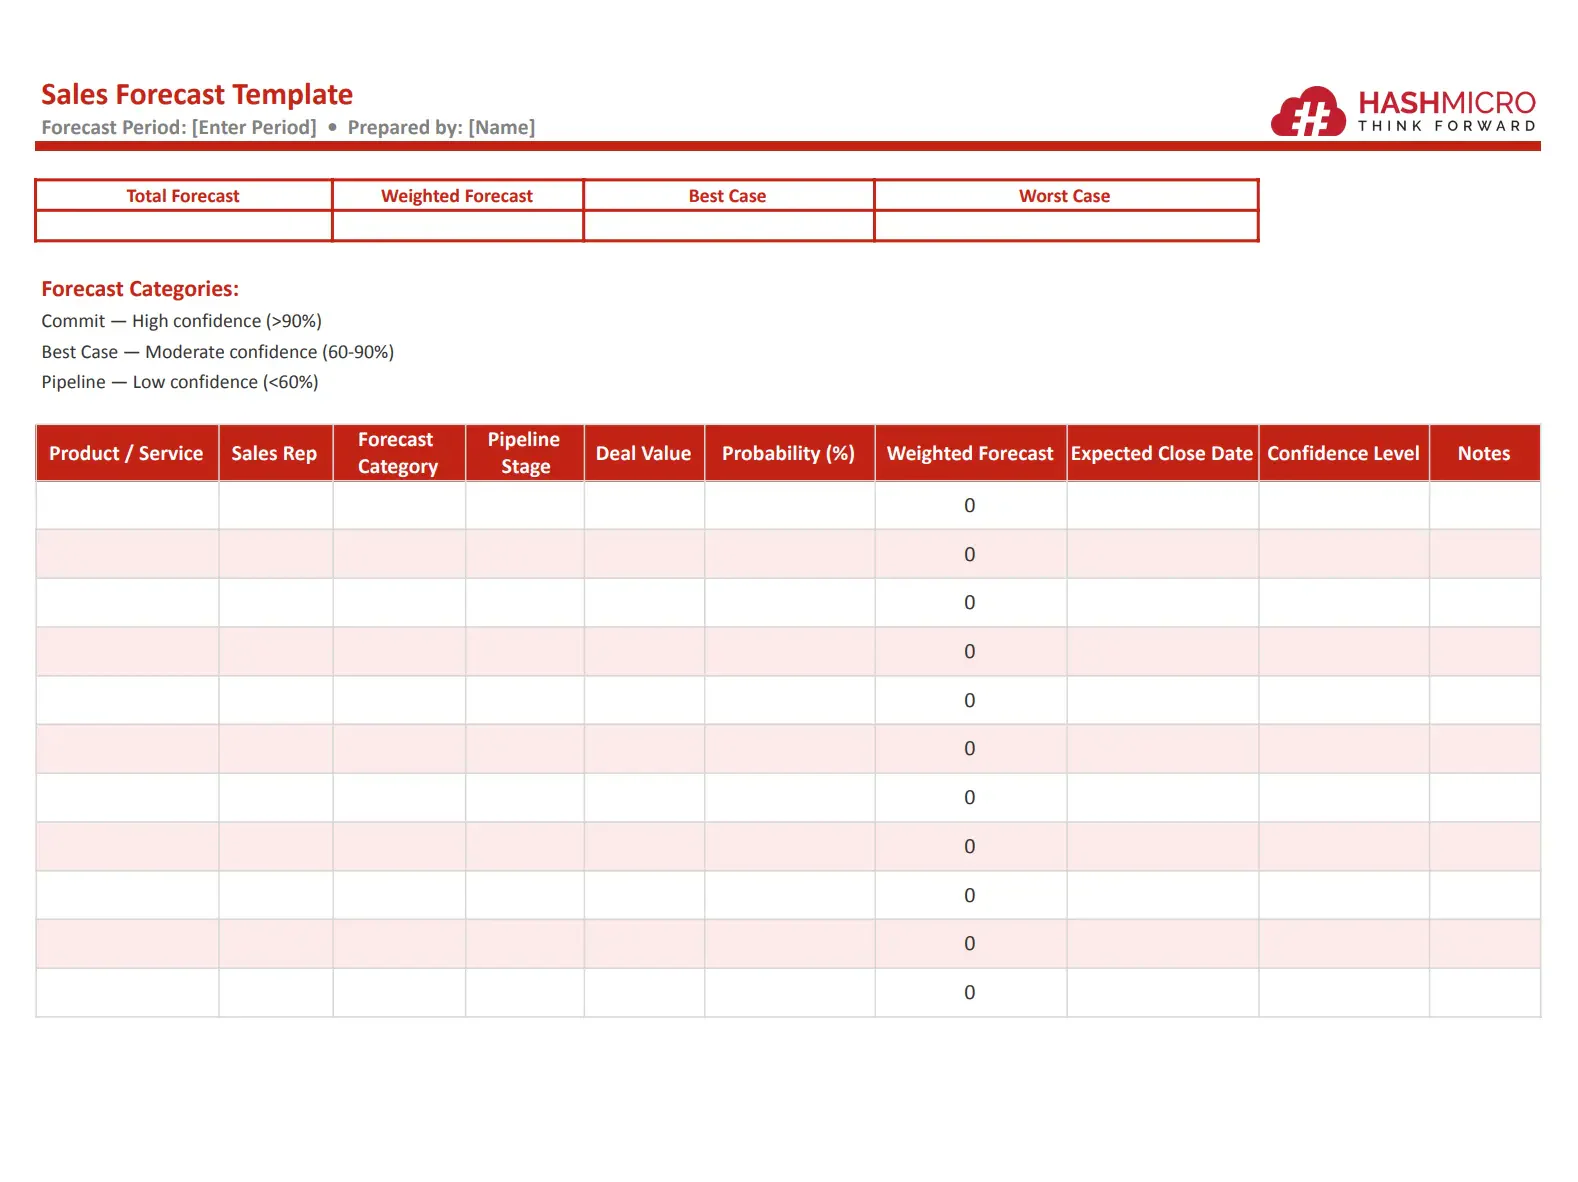
8. Sales forecast template
A sales forecast template estimates future revenue using historical data and current pipeline opportunities. It helps businesses plan budgets and resources.
TEMPLATE SALES FORECAST
Ready-to-use templates create a consistent structure, but compiling them manually can still take time. The banner below shows how Hashy AI turns live sales data into reports automatically.






Sales Report Examples
Reviewing examples can make it easier to understand how sales reports are structured and what insights they should provide. The examples below show how Australian businesses can present sales data clearly for better decision-making.
1. Example: Monthly sales report for an Australian retailer
An Australian retail business may use a monthly sales report to track store performance, product demand, and revenue growth. This helps management plan promotions, stock levels, and staffing needs.
Sample Data:
💡 Key Insight: Online sales increased strongly during the month, while in-store sales remained steady. Management may increase digital marketing spend and restock high-demand products.
2. Example: Quarterly sales report by state (NSW, VIC, QLD)
Businesses operating across Australia often compare performance by state to identify stronger markets and growth opportunities. This type of report is useful for regional planning and resource allocation.
Sample Data:
💡 Key Insight: Queensland recorded the highest growth rate, while New South Wales generated the largest revenue. The business may consider expanding sales coverage in QLD while maintaining strong investment in NSW.
How to Write a Sales Report Step by Step
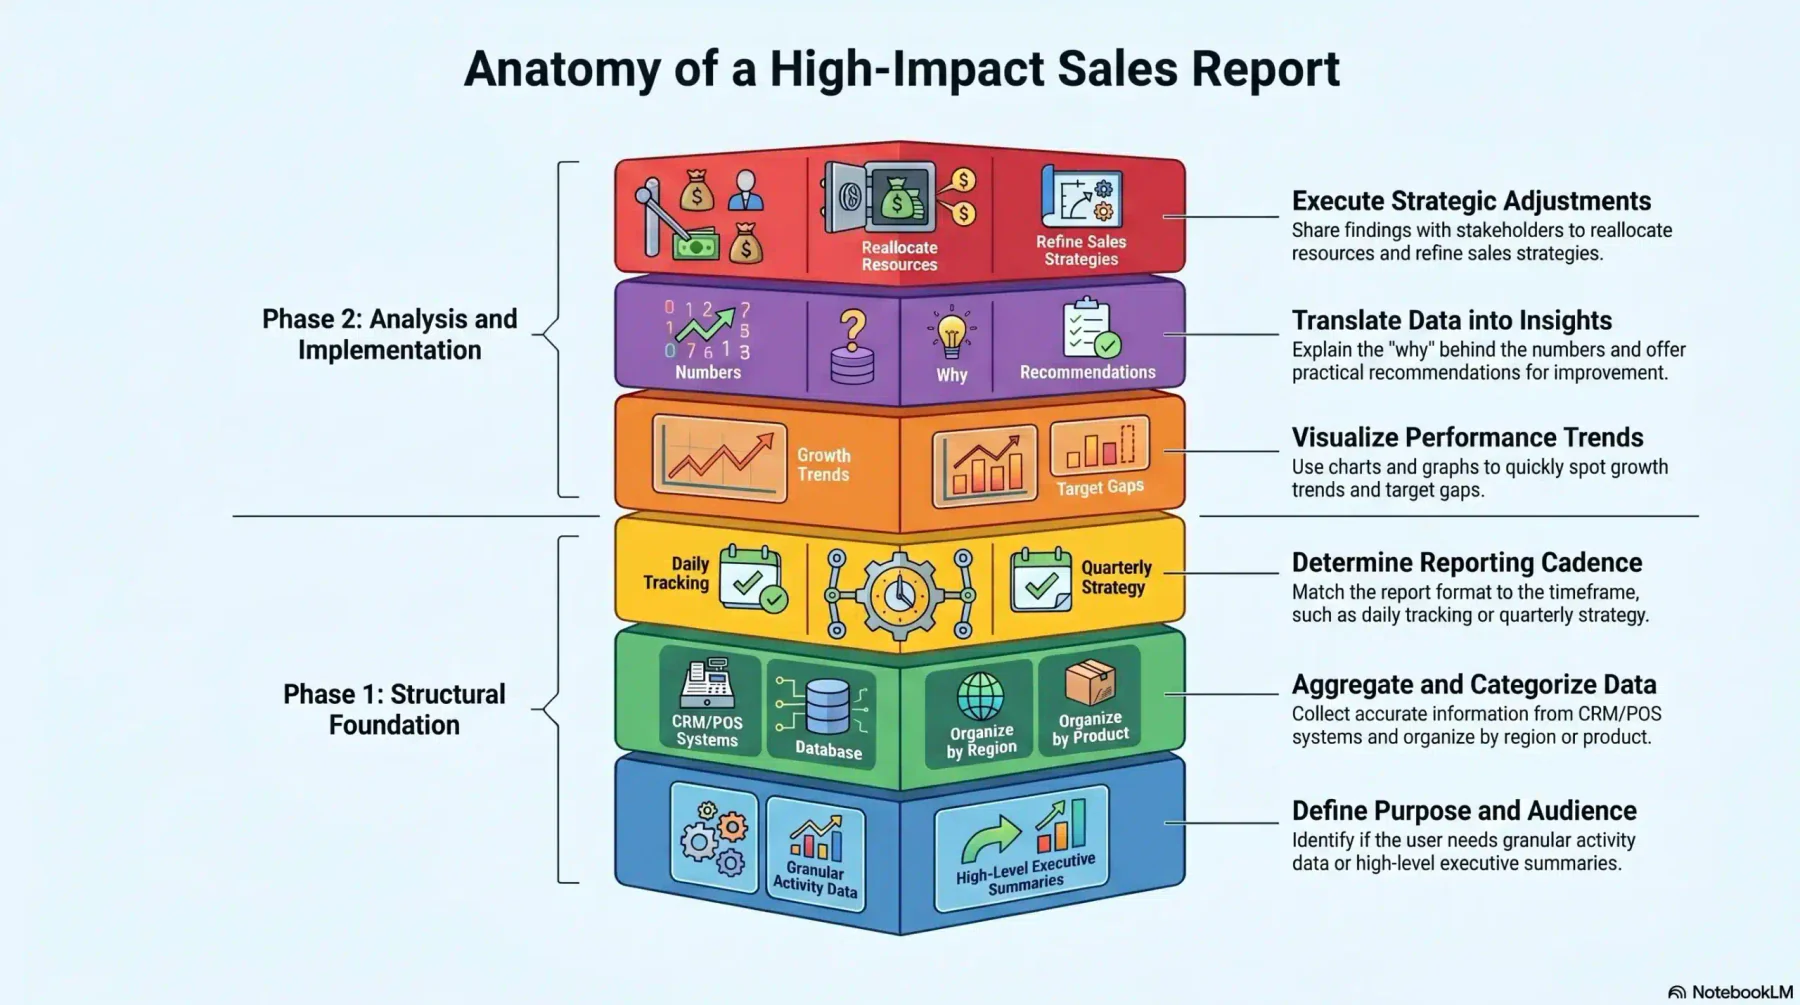
Creating an effective sales report is not just about listing numbers. A strong report should present clear insights, highlight performance trends, and support better business decisions. Follow these steps to build a useful and professional sales report.
1. Define the goal and audience
Start by identifying why the report is being created and who will use it. Sales representatives may need detailed activity data, while managers or executives usually prefer summaries focused on revenue, targets, and trends.
2. Gather and organise your sales data
Collect accurate sales data from your CRM, POS, or accounting software. Australian Government record-keeping guidance confirms that income and sales records must be retained.
3. Choose the right report type and format
Select a report type based on your reporting period and business needs. For example, use daily reports for activity tracking, monthly reports for management reviews, or quarterly reports for strategic planning.
4. Visualise key metrics and trends
Use charts, graphs, and tables to make important data easier to understand. Visual elements help readers quickly spot growth trends, target gaps, and high-performing products or regions.
5. Add context, insights, and recommendations
Numbers alone do not tell the full story. Explain what caused the results, highlight key opportunities or risks, and include practical recommendations for the next reporting period.
6. Share, review, and act on the report
Distribute the report to relevant stakeholders and review it regularly. Use the findings to improve sales strategies, adjust targets, allocate resources, and drive stronger performance moving forward.
How to Write a Sales Report Your Leadership Team Will Actually Use
Following a step-by-step process produces an accurate report. But accuracy alone does not guarantee leadership will find it useful. A report written for executives needs a different structure from one prepared for operations or finance.
The three principles below are what separate a report that gets read from one that gets filed:
- Lead with the outcome, not the data: Open with a one-paragraph summary covering whether the target was hit, by how much, and the single biggest driver. Executives should find the headline in the first five seconds, not the final table.
- Use one visual per insight: A bar chart comparing quarterly revenue by state is faster to absorb than five rows of figures. Reserve detailed tables for the appendix or operational follow-up.
- End with a clear next action: Every leadership report should close with one or two specific recommendations. This converts the report from a record into a decision-making tool.
Reports built for leadership prioritise clarity over completeness. The granular data belongs in your CRM or operational review; the version that goes upward should fit on one page or one screen.
Best Practices for Sales Reporting in Australia
Sales reporting in Australia should do more than measure revenue. It should also support tax compliance, improve visibility across teams, and help businesses make faster, data-driven decisions. The practices below can improve reporting accuracy and efficiency.
1. Align report cadence to BAS quarters and EOFY
Many Australian businesses prepare reports monthly, quarterly, and annually. Aligning your reporting schedule with BAS quarters and the EOFY period makes tax preparation, financial reviews, and planning much easier.
| Period | Report Type | AU Compliance Relevance |
|---|---|---|
| Monthly | Monthly Sales Report | GST liability tracking |
| Q1 (Jul–Sep) | Quarterly Report | Q1 BAS lodgement (October) |
| Q2 (Oct–Dec) | Quarterly Report | Q2 BAS lodgement (January) |
| Q3 (Jan–Mar) | Quarterly Report | Q3 BAS lodgement (April) |
| Q4 (Apr–Jun) | Annual + Quarterly | EOFY, tax return, final BAS |
2. Track GST-Exclusive and GST-Inclusive revenue separately
Separating GST-exclusive and GST-inclusive sales figures improves reporting accuracy and helps finance teams reconcile revenue correctly. This is especially important when preparing BAS lodgements and internal financial reports.
3. Use CRM software to automate data collection
Manual reporting can lead to delays and errors. CRM software helps automate data capture, generate real-time dashboards, and provide more accurate sales insights without relying on multiple spreadsheets. For businesses using an integrated ERP system, sales reports can be generated automatically from live transaction data.
What Australian Industries Track in Sales Reporting
Different industries in Australia use sales reports to track metrics that reflect their specific operations, compliance needs, and revenue models. Understanding what to measure by industry helps businesses build more relevant and actionable reports.
Retail & E-Commerce AU: Track GST per transaction, cart abandonment, revenue per store/location, EOFY clearance sales impact.
Professional Services AU: Track billable hours converted to revenue, contract value, retainer renewal rate.
Wholesale & Distribution AU: Track order value, fill rate, state-by-state sales velocity.
Hospitality AU: Track RevPAR, covers per service, F&B vs accommodation revenue split.
Conclusion
A sales report is more than a summary of past results, it is a practical tool for improving future performance. Whether you need a daily update, monthly review, or annual performance summary, using the right report format helps turn raw data into clear insights.
For Australian businesses, aligning reports with BAS quarters, EOFY, and GST requirements can also improve financial accuracy and compliance.
With the right templates, metrics, and reporting tools in place, sales reports become a valuable part of driving growth, increasing efficiency, and achieving long-term business success.
Consult our experts to understand how the right sales reporting solution can improve visibility, accuracy, and business growth.

Frequently Asked Question
The ideal reporting frequency depends on your BAS obligations. Quarterly BAS lodgers should review sales reports monthly and conduct a quarterly review before lodgement. Businesses with annual BAS obligations can use monthly reporting and an annual review, while high-volume retail and e-commerce businesses may also need daily or weekly reports to monitor performance and make timely decisions.
A sales report documents what has happened like actual revenue, closed deals, and performance metrics for a completed period. A sales forecast projects what will happen like expected revenue based on pipeline data, conversion rates, and historical trends. The report validates your forecast accuracy, and the forecast helps you plan resourcing, inventory, and cash flow for the next period.
Structure your monthly BAS-ready sales report with four sections: (1) Total taxable sales separated into GST-applicable and GST-free categories; (2) Revenue by product or service line; (3) New vs. repeat customer revenue split; (4) Variance vs. prior month with a brief commentary. Always cross-reference with your accounts receivable ledger before lodging.
For businesses with fewer than 10 sales reps and simple product lines, a well-structured spreadsheet is sufficient. For businesses managing multi-state teams, multiple product lines, or more than 50 active deals in the pipeline, CRM-based reporting is more reliable.
EOFY (June 30) is the most important reporting period for Australian businesses. Your annual sales report should include total revenue for FY Jul-Jun, GST collected and remitted, top customers by revenue (for relationship review and credit risk assessment), and YoY growth rate. For businesses with staff, cross-referencing sales data with payroll records also helps validate sales commission calculations and PAYG withholding obligations.