


Break even analysis shows the sales point where revenue covers total costs. It helps businesses understand whether pricing, costs, and sales targets are strong enough to support profitability.
Businesses use break even analysis by comparing fixed costs, variable costs, selling price, and contribution margin. From there, they can set a realistic sales target before launching, expanding, or changing prices.
Key Takeaways
Break even analysis identifies the sales point where revenue covers total costs.
The break-even point formula helps businesses calculate required units, sales revenue, and contribution margin.
Calculating break-even point starts with fixed costs, variable costs, selling price, and contribution margin.
Common break-even mistakes can make sales targets and profitability assumptions less accurate.
What Is Break Even Analysis?
Break even analysis is a financial calculation used to identify the point where total revenue equals total costs. At this point, the business has covered its expenses but has not yet made a profit.
The result is called the break-even point. It shows the minimum sales level a business needs before profit can begin.
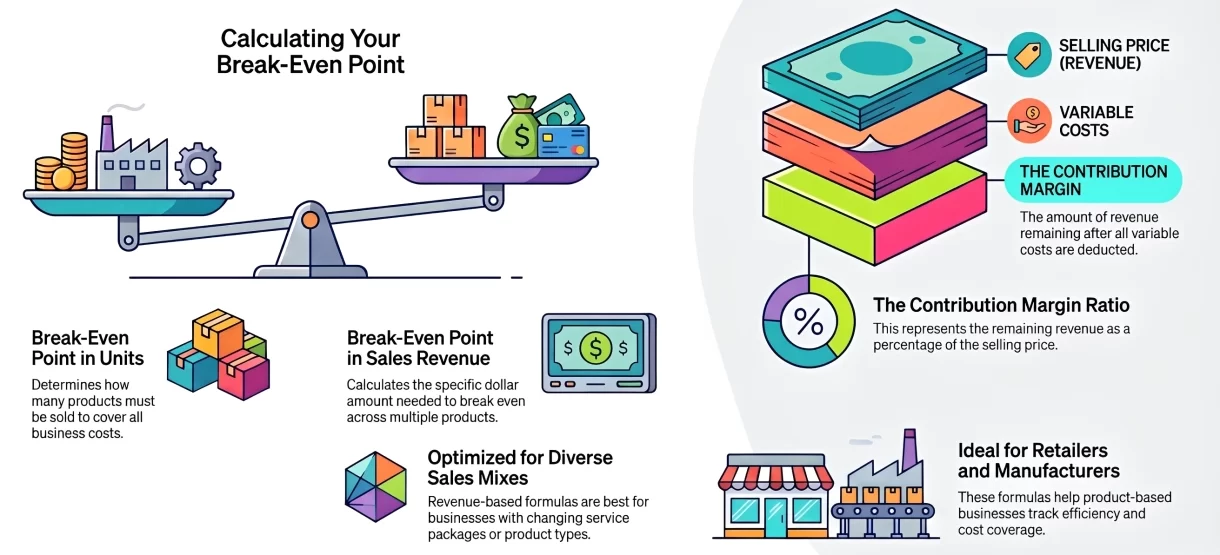
Businesses can calculate the break-even point in units sold or total sales revenue. Unit-based calculations are useful for product sales, while revenue-based calculations work well for businesses with multiple products or services.
Why Break Even Analysis Matters for Australian Businesses
Break even analysis helps businesses turn sales goals into measurable financial targets. Instead of relying on assumptions, teams can calculate how much they need to sell to cover costs.
This is especially useful when operating costs change. Rent, wages, insurance, freight, supplier costs, utilities, and software subscriptions can all affect the break-even point.
Businesses also use break even analysis before changing prices, launching products, expanding operations, or reviewing cost control. It provides valuable financial insights that help managers understand whether a decision is financially realistic before committing resources.
Break Even Point Formula
The break-even point formula can be calculated in units or in sales revenue. The right formula depends on whether the business needs a unit target or a revenue target.
1. Break-even point in units
Use this formula when you want to know how many products or services must be sold to cover total costs. It is commonly used by retailers, manufacturers, wholesalers, and product-based businesses.
2. Break-even point in sales revenue
Use this formula when you want to know the amount of sales revenue needed to break even. This works well for businesses with multiple products, service packages, or changing sales mixes.
3. Contribution margin formula
Contribution margin shows how much revenue remains after variable costs are deducted. A contribution margin ratio shows that amount as a percentage of the selling price.
A higher contribution margin usually lowers the break-even point. This is because each sale contributes more toward fixed costs before profit begins.

How to Calculate Break Even Point
To calculate break-even point accurately, businesses need reliable cost and pricing data. The calculation starts with fixed costs, variable costs, selling price, and contribution margin.
1. Identify fixed costs
Fixed costs are expenses that usually stay the same regardless of sales volume. These may include rent, salaries, insurance, subscriptions, equipment leases, loan repayments, and some utilities.
2. Identify variable costs
Variable costs change based on the number of units sold or services delivered. Common examples include materials, packaging, freight, commissions, payment processing fees, and direct labour.
3. Set the selling price
The selling price is the amount charged to customers for each product or service. If discounts are common, businesses should use the actual selling price after discounts rather than the list price.
4. Calculate contribution margin
Contribution margin is calculated by subtracting variable cost per unit from selling price per unit. It shows how much each sale contributes toward fixed costs and future profit.
5. Apply the break-even formula
Once fixed costs and contribution margin are known, divide fixed costs by contribution margin per unit. The result shows how many units the business needs to sell to break even.
The business must sell 500 units per month to break even. Any sales above that point can start contributing to profit if prices and costs remain stable.
Break Even Analysis Example
Consider an Australian food wholesaler that sells packaged products to cafes and retailers. The business wants to know how many units it must sell each month before revenue covers total costs.
In this example, the wholesaler must sell 1,000 units per month to break even. Sales above 1,000 units can start contributing to profit, while sales below that level may leave the business operating at a loss.
If variable cost increases from AUD 50 to AUD 55, the contribution margin falls to AUD 25. The new break-even point becomes 1,200 units, which means the business must sell more products to cover the same fixed costs.
When Should Businesses Use Break Even Analysis?
Businesses can use break even analysis whenever they need to compare costs, pricing, and sales targets. It is useful for both new decisions and regular financial reviews.
1. Before launching a new product
Before launching a new product, businesses can estimate how many units must be sold to cover production, marketing, and distribution costs. This helps teams decide whether the product has realistic profit potential.
2. When changing prices
Price changes directly affect the break-even point. A higher price may reduce the number of units needed to break even, while a lower price may require stronger sales volume.
3. When fixed costs increase
Rent, wages, insurance, equipment leases, and subscriptions can increase over time. Break even analysis helps businesses check whether current sales levels can still cover these expenses.
4. When planning business expansion
Opening a new location, buying equipment, hiring staff, or entering a new market often increases fixed costs. Businesses can use break even analysis to calculate the extra sales needed before committing to expansion.
5. When setting sales targets
Break even analysis helps finance and sales teams set practical revenue or unit targets. Instead of using rough estimates, teams can base targets on the minimum sales needed to cover costs and support profit.
Common Break Even Analysis Mistakes
Break even analysis is simple to use, but the result can become misleading when the input data is incomplete or inaccurate. Businesses should review the following mistakes before relying on the calculation.
1. Mixing fixed and variable costs
Some expenses are not always easy to classify. If a business places fixed costs under variable costs, or the other way around, the break-even point may become inaccurate.
2. Ignoring changes in demand
The formula shows how much a business needs to sell, but it does not guarantee customers will buy that volume. Demand can change due to pricing, competitors, market conditions, or customer behaviour.
3. Using one average price for many products
Businesses with multiple products may have different prices, margins, and cost structures. Using one average price can hide which products improve profitability and which ones increase break-even risk.
4. Forgetting indirect costs
Some businesses include direct product costs but miss overheads such as admin wages, warehousing, insurance, software, and utilities. Missing these costs can make the break-even point look lower than it really is.
5. Treating break-even as profit
Break-even only means the business has covered its total costs. Profit starts after sales exceed the break-even point.
How to Lower Your Break Even Point
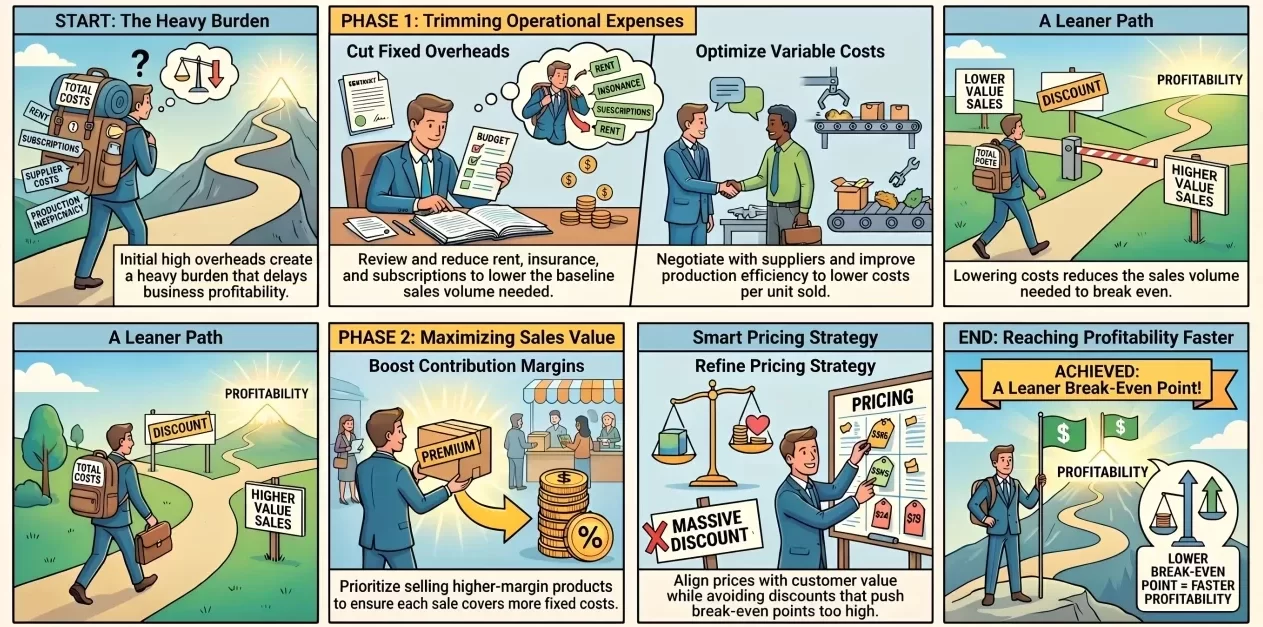
A lower break-even point means a business needs fewer sales to cover costs. This can improve financial resilience when demand slows, costs rise, or market conditions change.
1. Reduce fixed costs
Businesses can review rent, subscriptions, equipment leases, insurance, and other overheads. Lower fixed costs reduce the sales volume needed to break even. Regularly monitoring budget performance can also help identify overhead expenses that may be reduced without affecting operations.
2. Lower variable costs
Variable costs can be reduced through supplier negotiation, better production efficiency, less packaging waste, and more efficient freight planning. Even small cost reductions can improve contribution margin.
3. Increase contribution margin
Contribution margin can increase when a business raises prices, lowers variable costs, or sells more higher-margin products. A stronger contribution margin helps each sale cover more fixed cost.
4. Improve pricing strategy
Pricing should reflect cost, customer value, competitor position, and market demand. Businesses should avoid heavy discounting if it pushes the break-even point beyond realistic sales volume.
5. Focus on higher-margin products
Some products contribute more to profitability than others. Prioritising higher-margin products in sales, marketing, and inventory planning can improve overall financial performance.
How Accounting Software Supports Break Even Analysis
Accounting software connects cost, sales, inventory, purchasing, and financial data in one system. This helps businesses calculate break-even point using current information instead of spreadsheet assumptions, while serving as a business profitability tracker.
With clearer visibility over fixed costs, variable costs, product margins, and sales revenue, finance teams can update break-even calculations more accurately. This is especially useful when prices, supplier costs, wages, or sales volume change.
Benefits of Using Accounting Software for Break Even Analysis
- Centralised cost data: Keeps fixed costs, variable costs, and sales information in one system.
- Real-time sales visibility: Helps managers compare actual sales against break-even targets.
- Better margin tracking: Shows which products or services contribute more to profitability, making accounting software useful as software for profit tracking across different product lines.
- Faster financial reporting: Reduces manual reporting work and improves decision speed.
- More accurate pricing decisions: Supports pricing reviews using updated cost and revenue data.
For businesses managing multiple products, warehouses, branches, or sales channels, accounting software can help keep financial and operational data easier to review for break-even planning through tools for automating financial workflows.
Conclusion
Break even analysis helps businesses understand the sales level needed to cover total costs. By comparing fixed costs, variable costs, selling price, and contribution margin, teams can make clearer decisions about pricing and sales targets.
Regularly reviewing the break-even point is useful when costs rise, prices change, or product demand shifts. Accurate calculations help businesses plan more carefully and avoid assuming that strong sales automatically mean profit.
If you want to improve financial visibility and cost planning, you can consult our expert to see how accounting software can support your business.

Frequently Asked Question
A good break-even point depends on the business model, industry, margin, and cost structure. In general, a lower break-even point gives a business more flexibility because it needs fewer sales to cover costs.
Break-even analysis usually focuses on business revenue and costs, so GST treatment depends on how the business records its figures. GST-registered businesses generally separate GST collected from revenue because it is paid to the ATO.
Break-even analysis should include fixed costs such as rent, salaries, insurance, and subscriptions, as well as variable costs such as materials, packaging, freight, commissions, and direct labour.
Yes. Service businesses can use break-even analysis by replacing product units with billable hours, service packages, projects, or customer contracts.
A business should recalculate its break-even point whenever prices, costs, wages, supplier rates, rent, product mix, or sales volume change. Many businesses review it monthly or quarterly as part of financial reporting and budgeting.
