A chart of accounts is the structured list of all financial accounts a business uses to record transactions. It organises income, expenses, assets, liabilities, and equity into a clear framework that drives accurate financial reporting.
For Australian businesses, a well-built chart of accounts also needs to support GST reporting and BAS lodgement. Without a clean account structure, tax preparation takes longer, reports lose accuracy, and financial decisions rely on incomplete information.
This guide covers what a chart of accounts is, why it matters, real examples across different business types, a practical template, and a step-by-step setup process.
Key Takeaways
Chart of accounts is an organised list of every financial account a business uses to record transactions, driving accurate reporting and GST compliance.
Main account categories include assets, liabilities, equity, revenue, cost of goods sold, and expenses, each serving a distinct role in financial statements.
How to set up a chart of accounts involves reviewing your business structure, choosing categories, assigning codes, adding GST accounts, and confirming with your accountant.
Chart of accounts in accounting software or ERP keeps accounts consistent across teams, automates GST mapping, and supports multi-entity financial reporting.

What is a Chart of Accounts?
A chart of accounts is an organised index of every account in a business’s general ledger. Each account has a unique code, a name, and a category that determines where it appears in financial statements.
Think of it as a filing system for every financial transaction a business records. When a staff member logs a purchase or a sale, they code it to an account in this list, which then feeds into reports automatically.
Most charts of accounts group accounts into five or six core categories: assets, liabilities, equity, revenue, and expenses. Businesses that carry inventory or manage production costs often add a cost of goods sold category as well.
Why is a Chart of Accounts Important for Businesses?

A chart of accounts shapes how clearly a business can read its financial position at any point in time. Beyond simple organisation, it drives reporting accuracy, tax compliance, and consistent processes across the team.
The sections below cover the main reasons a well-designed chart of accounts matters for Australian businesses.
Cleaner financial reporting
Core financial records stay accurate when every transaction lands in the right place. Income statements, balance sheets, and cash flow reports all pull from the same account list, so the figures in each report stay consistent.
When accounts are unclear or poorly categorised, reports can distort the business’s real financial position. For example, coding a capital purchase as an expense inflates costs and understates assets on the balance sheet.
Easier tax and BAS preparation
Finance platforms in Australia help businesses registered for GST report GST collected and input tax credits on their Business Activity Statement. A chart of accounts mapped to the correct GST treatments makes BAS preparation faster and reduces the risk of lodgement errors.
Clear separation between taxable, GST-free, and input-taxed accounts also makes it easier to respond to ATO queries. If the account structure is muddled, reconciling GST at BAS time becomes a manual and time-consuming task.
Better expense tracking
Splitting expenses into meaningful accounts gives business owners and managers a clearer view of where money goes each month. Accounts for wages, rent, marketing, and utilities each tell a specific cost story.
For example, a manager reviewing a monthly profit and loss report can quickly see whether wages are tracking above budget. Without separate accounts, that kind of comparison requires manual sorting of raw transaction data.
More consistent accounting processes
When a business runs from a defined chart of accounts, every bookkeeper codes transactions the same way. This consistency matters as the team grows or when accounting staff change.
Consistent coding also speeds up audits and financial reviews. Reviewers can trust that similar transactions always appear in the same accounts, which makes pattern analysis and reconciliation much simpler.
Main Chart of Accounts Categories

A chart of accounts typically groups accounts into five or six standard categories. Understanding what belongs in each category helps businesses code transactions correctly from the beginning.
Assets
Asset accounts record what a business owns or controls. These include cash at bank, accounts receivable, inventory, prepaid expenses, and fixed assets such as vehicles and equipment.
Assets divide into two types: current assets, which the business expects to convert to cash within twelve months, and non-current assets with a longer useful life. Keeping these separate gives a more accurate picture of short-term liquidity.
Liabilities
Liability accounts record what a business owes. Common examples include accounts payable, GST payable, PAYG withholding payable, superannuation payable, credit card balances, and bank loans.
As with assets, liabilities split into current (due within twelve months) and non-current (due after twelve months). Clear liability accounts help businesses track upcoming payment obligations and manage cash flow.
Equity
Equity accounts record the owner’s interest in the business after liabilities are subtracted from assets. For a company, equity typically includes share capital and retained earnings. For a sole trader, it usually covers owner’s capital and drawings.
Equity accounts help businesses track how profits flow back into the business or how withdrawals reduce the owner’s stake over time. These accounts tie the balance sheet together.
Revenue
Revenue accounts record income earned from selling goods or services. A retail business may separate revenue by product category, while a service business might split income by service type or project.
Detailed revenue accounts make it easier to compare income streams and identify which parts of the business generate the most value. They also help with GST mapping for BAS reporting.
Cost of goods sold
Cost of goods sold (COGS) accounts record the direct costs tied to producing or purchasing the goods a business sells. These typically include purchases, freight in, and inventory adjustments.
Service businesses without physical inventory may not use COGS accounts at all. For product-based businesses, separating COGS from general expenses gives a cleaner view of gross profit margin.
Expenses
Expense accounts cover the costs a business incurs to operate. Common categories include wages, rent, insurance, utilities, marketing, professional fees, and depreciation.
Many businesses break expenses into sub-groups to make management reporting more useful. For instance, separating staff costs from occupancy costs and marketing costs helps managers review each cost driver on its own.
Chart of Accounts Example
The examples below show how different business types structure their charts of accounts. Account codes typically follow a standard range: 1000s for assets, 2000s for liabilities, 3000s for equity, 4000s for revenue, 5000s for COGS, and 6000s for expenses.
Basic chart of accounts example
A basic chart of accounts suits a small business or sole trader with straightforward transactions and limited account complexity.
Service business chart of accounts example
A service business does not carry physical inventory, so COGS accounts are minimal or absent. Revenue accounts may split by service type or contract type.
Retail business chart of accounts example
A retail business needs inventory accounts and COGS accounts to track the cost of goods sold and ending stock levels at each reporting period.
Manufacturing business chart of accounts example
A manufacturing business tracks raw materials, work in progress, and finished goods as separate asset accounts. COGS accounts are also more detailed to capture direct materials, direct labour, and overhead.
Chart of Accounts Template
A chart of accounts template gives businesses a consistent structure to follow when setting up or reorganising their accounts. Each field in the template serves a specific purpose in keeping financial records clean and reportable.
Account code
Account codes are numerical identifiers assigned to each account. Most businesses use a four or five-digit system that groups accounts by category, making it easy to sort and filter accounts in reports.
For example, 1000–1999 covers assets, 2000–2999 covers liabilities, and so on. Leave gaps between codes so new accounts can be added later without disrupting the existing sequence.
Account name
The account name describes what each account records. Good names are short, specific, and consistent across the whole chart.
For instance, “Wages and Salaries Expense” is clearer than “Staff Costs” because it identifies the exact nature of the expense. Avoid abbreviations or shorthand that a new bookkeeper or external reviewer would not immediately understand.
Account type
The account type tells the accounting system where each account belongs in financial statements. Common types include asset, liability, equity, revenue, COGS, and expense.
Accounting software uses account types to build reports automatically. If an account carries the wrong type, it will appear in the wrong section of the balance sheet or income statement, which distorts the financial picture.
Description
A description field explains what kinds of transactions should be coded to each account. This is especially useful for new staff or external bookkeepers who are not yet familiar with how the business operates.
For example, a description might read: “Record all sales of finished goods to retail customers, including both in-store and online orders.” Clear descriptions reduce miscoding and make reviews faster.
GST or tax treatment
Each account should have a default GST or tax treatment assigned from the start. Common treatments for Australian businesses include taxable (10% GST), GST-free, input-taxed, and out-of-scope.
Setting a correct default allows accounting software to apply the right treatment automatically when transactions are entered. This reduces BAS errors and saves considerable time at each lodgement period.
How to Set Up a Chart of Accounts
Preparing financial statements accurately starts with setting up a chart of accounts in a deliberate order. The sections below walk through the full process from reviewing the business structure through to getting sign-off from an accountant.
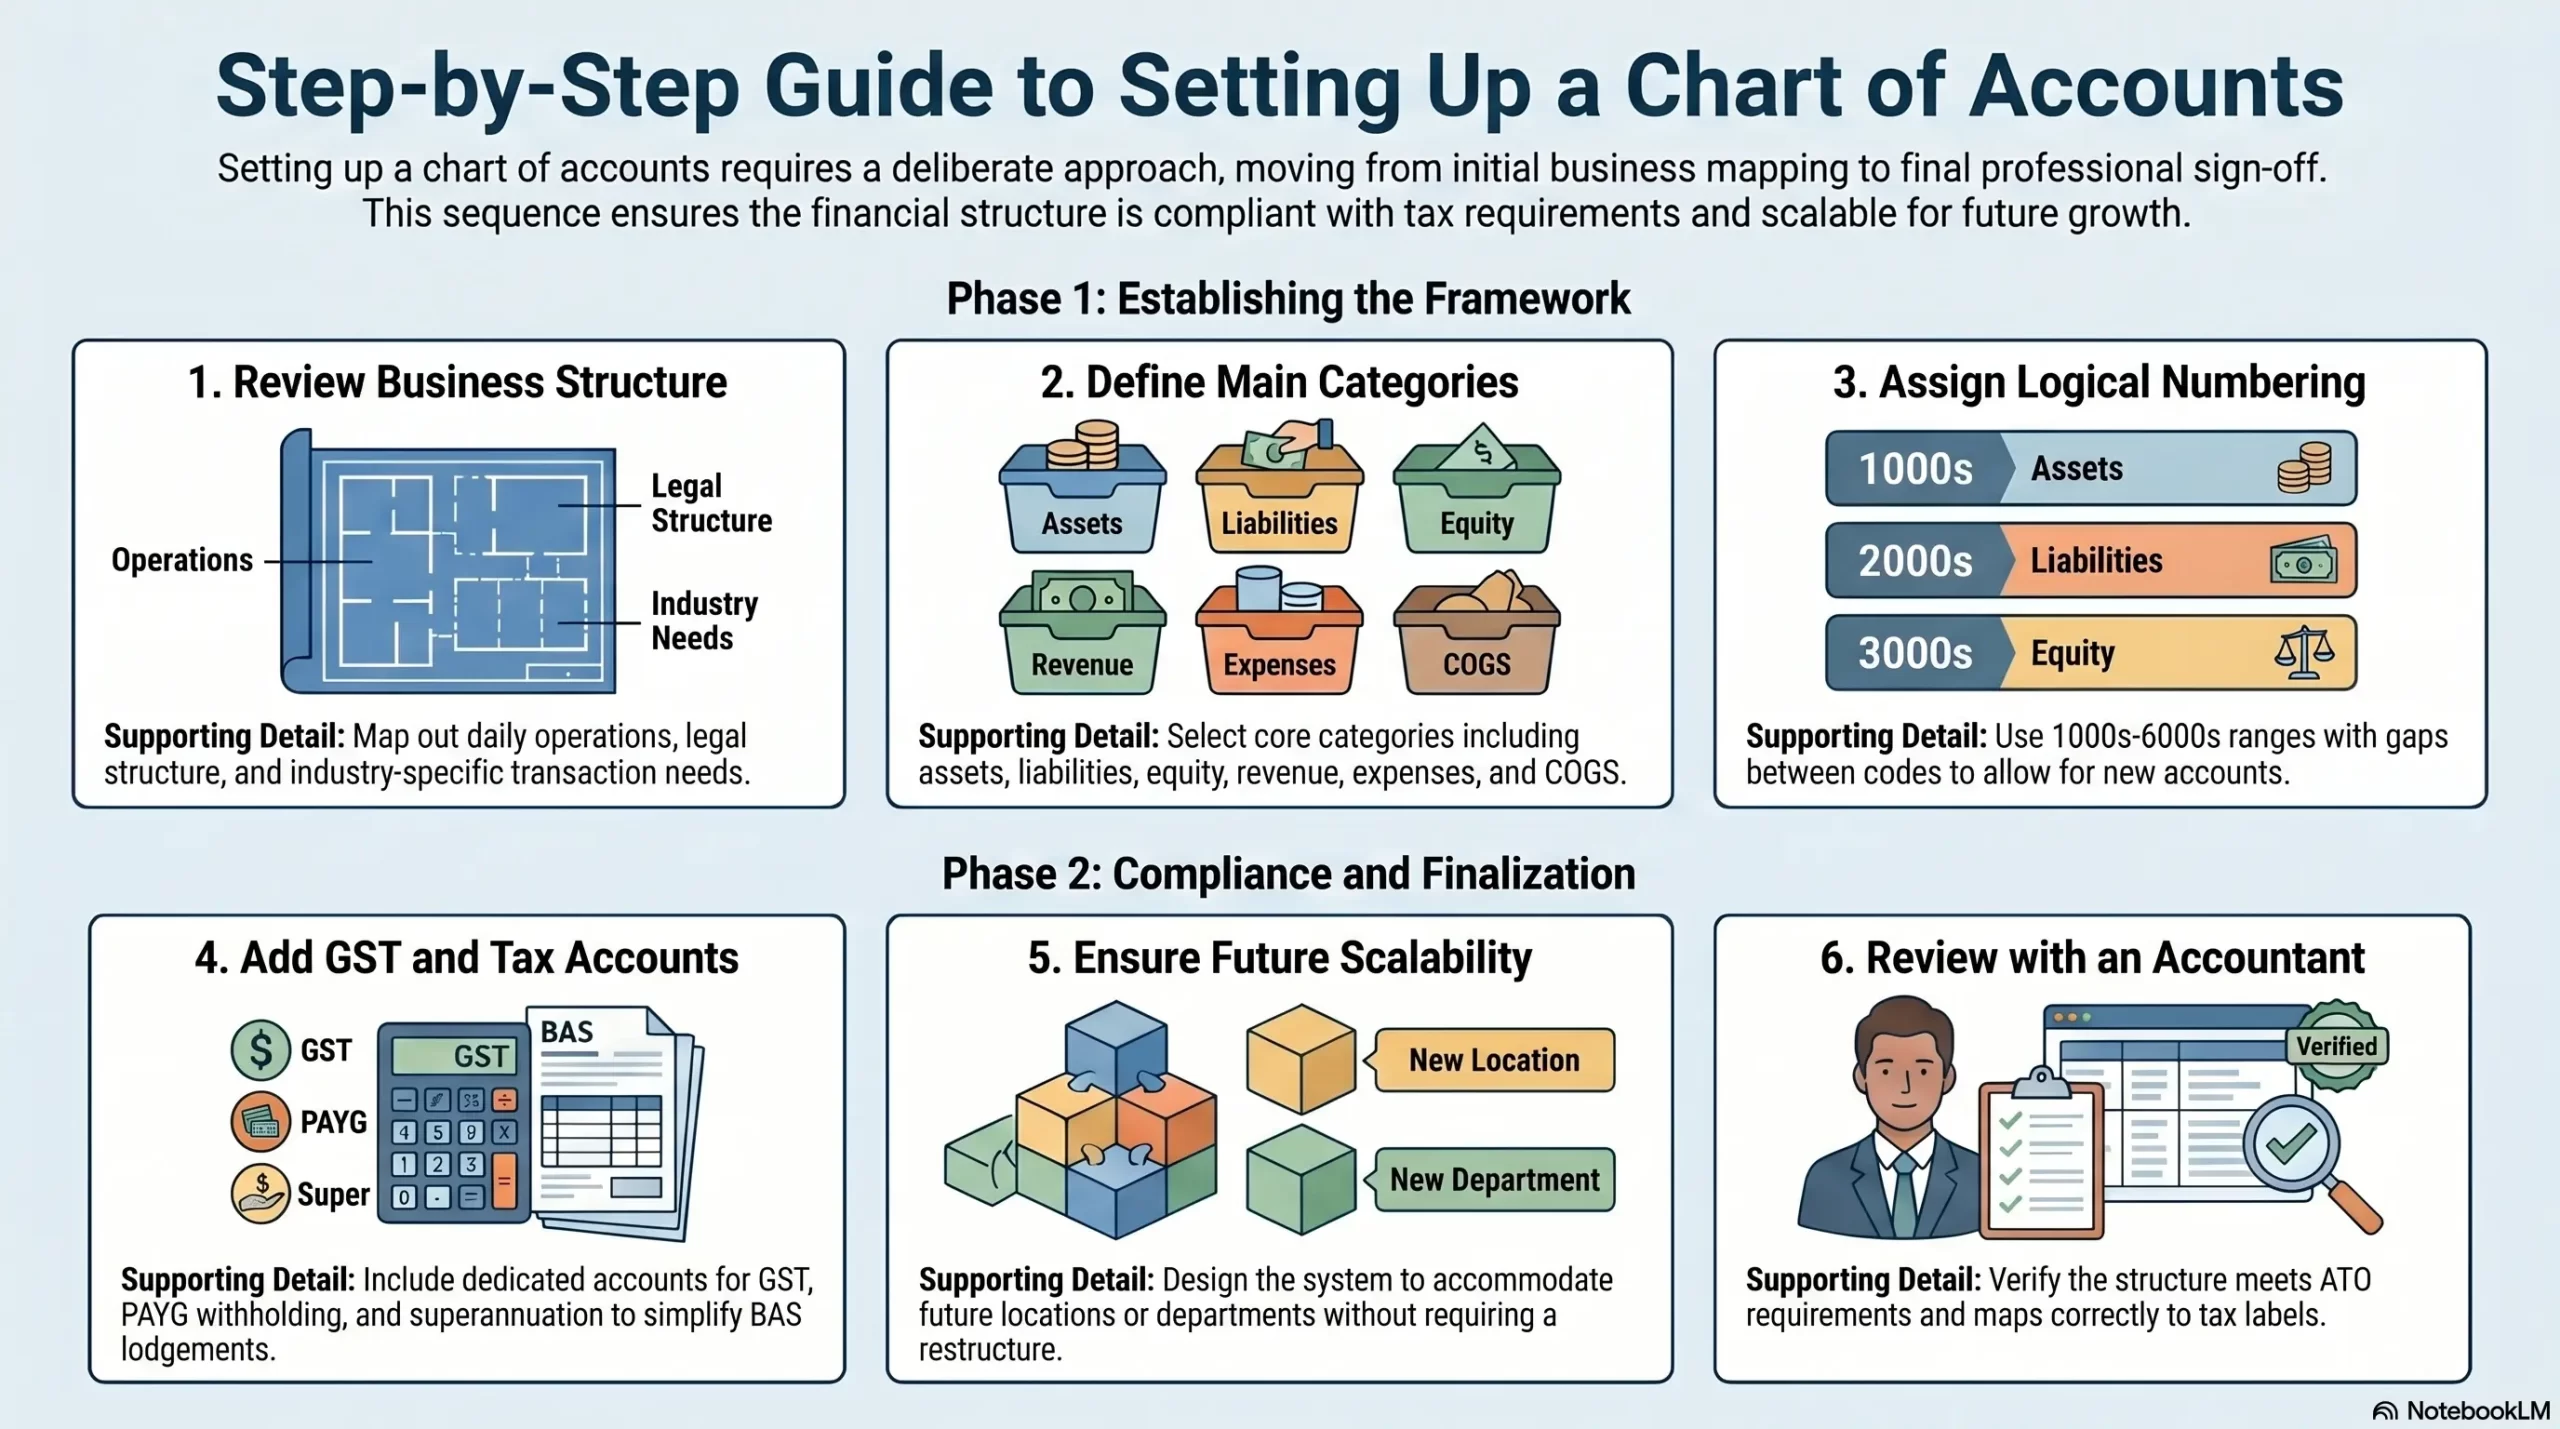
1. Review your business structure
Start by mapping out how the business operates and what kinds of transactions it records regularly. A sole trader in professional services has different accounting needs than a company that holds inventory or employs a large team.
Consider the legal structure, the industries the business operates in, and whether there are multiple locations or entities. These factors directly influence which accounts are needed and how detailed the structure should be.
2. Choose account categories
Next, decide which main categories and sub-categories the chart will include. Most Australian businesses need assets, liabilities, equity, revenue, and expenses at minimum.
If the business carries inventory or has significant production costs, add a COGS category. For businesses with complex overhead or multi-department operations, sub-categories within expenses add useful reporting detail.
3. Assign account numbers
Once the categories are confirmed, assign a consistent numbering system. Reserve code ranges for each category: 1000s for assets, 2000s for liabilities, 3000s for equity, 4000s for revenue, 5000s for COGS, and 6000s onwards for expenses.
Leave gaps between numbers within each range. For example, use 6010, 6020, and 6030 rather than 6001, 6002, and 6003 so that new accounts can slot in without renumbering the existing ones.
4. Add GST and tax-related accounts
Australian businesses registered for GST need dedicated accounts for GST collected, GST paid (input tax credits), PAYG withholding, and superannuation payable. These accounts ensure that BAS lodgements stay accurate and reconcilable.
If the business has both taxable and GST-free sales, consider creating separate revenue accounts for each type. This makes GST reconciliation far faster at the end of each BAS period and reduces the risk of reporting errors.
5. Keep the structure scalable
Design the chart with future growth in mind. Adding accounts later is straightforward, but restructuring categories after many transactions have been coded causes reporting inconsistencies that take time to fix.
For example, if the business plans to expand to multiple locations, leave room in the numbering system to add location-specific accounts or department codes without rebuilding the whole chart from scratch.
6. Review with your accountant
Before locking in the final chart of accounts, review it with an accountant or registered tax agent. They can confirm whether the structure aligns with ATO reporting requirements and any industry-specific standards that apply to the business.
Your accountant can also identify accounts that may cause issues at tax time, such as accounts that unintentionally mix personal and business expenses or that do not map cleanly to BAS labels.
Common Chart of Accounts Mistakes to Avoid
Even well-run businesses make chart of accounts mistakes that create problems later. The issues below are the most common ones, along with practical ways to address each one.
Creating too many accounts
More accounts do not automatically mean better reporting. Businesses sometimes create a new account for every minor expense category, which makes the chart hard to navigate and maintain over time.
A better approach is to group similar expenses into one account and use descriptions or tracking categories for extra detail. For instance, one “Office Supplies” account with clear descriptions works better than five separate stationery accounts.
Mixing personal and business expenses
Coding personal expenses into business accounts creates compliance risk and distorts financial reports. This is particularly common for sole traders who use business accounts for personal purchases.
The fix is to keep personal and business finances completely separate. When a business owner needs to draw money from the business, they should use a dedicated drawings or owner’s withdrawals account rather than coding personal costs as business expenses.
Using inconsistent account names
When different staff members create accounts using different naming conventions, reports become harder to read and reconcile. For example, having both “Wages Expense” and “Salaries” for similar costs causes confusion in payroll reporting.
Set naming conventions before accounts are created and enforce them consistently. Review the list regularly to merge duplicates and rename any accounts that are unclear or misleading.
Ignoring GST and BAS reporting needs
A chart of accounts that does not reflect GST obligations creates extra manual work at BAS time. For example, coding taxable and GST-free sales to the same revenue account makes it impossible for the software to calculate GST automatically.
Map each revenue and expense account to the correct GST treatment from the start. This allows accounting software to pre-fill GST fields and significantly reduces BAS preparation time.
Not reviewing accounts regularly
Business needs change over time, and the chart of accounts should reflect those changes. A business that has grown, changed its service mix, or restructured may find that its original account structure no longer fits what it actually does.
Review the chart of accounts at least once a year, ideally before the financial year ends. Archiving accounts that are no longer needed and adding accounts for new activities keeps the structure clean and useful.
Chart of Accounts in Accounting Software

A digital bookkeeping framework makes it far easier to manage a chart of accounts without relying on manual spreadsheets. The right system keeps accounts consistent, automates GST mapping, and scales with the business as it grows.
How software keeps accounts consistent
Automated bookkeeping processes rely on a master chart of accounts that all users work from. When a team member enters a transaction, they select from the same shared list of accounts rather than typing freeform descriptions.
This approach prevents duplicates, naming inconsistencies, and miscoding. It also makes reports more reliable because every transaction follows the same coding rules, regardless of who entered it.
How ERP supports multi-entity chart of accounts
Businesses with multiple entities, locations, or cost centres need more than basic accounting software can offer. An ERP system allows businesses to maintain a standardised chart of accounts across all entities while still producing separate financial statements for each one.
For example, a business group with three subsidiaries can share the same account structure across all three, which makes consolidated reporting and intercompany reconciliation faster and more accurate. Finance teams spend less time reformatting data and more time reviewing actual results.
When to move beyond spreadsheets
Spreadsheets can work for very small businesses with simple finances. As transaction volumes grow, manual spreadsheets become error-prone, time-consuming, and difficult to audit.
Signs a business needs dedicated software or an ERP include growing inventory, multiple staff coding transactions, regular BAS lodgements with many accounts, and a need for real-time financial visibility across departments or locations.
How HashMicro Helps Businesses Manage Their Chart of Accounts
HashMicro’s accounting module gives businesses a structured, scalable chart of accounts connected directly to the general ledger, BAS reporting, and financial statements.
Users can set up account codes, assign GST treatments, and map accounts to the right report sections from a single setup screen. As a result, businesses spend less time correcting coding errors and more time reviewing financial performance.
HashMicro also supports multi-entity and multi-currency accounting, which means businesses with more than one company or location can maintain a consistent chart of accounts across their entire group. Integration with inventory, payroll, and purchasing feeds transactions into the chart of accounts automatically, without manual journal entries or spreadsheet reconciliation.
Conclusion
A well-designed chart of accounts gives businesses a clear and reliable view of their financial position. By grouping transactions into the right categories from the start, businesses can produce accurate reports, prepare BAS more efficiently, and make faster, better-informed decisions.
Whether setting up accounts for the first time or reorganising an existing structure, a consistent approach saves significant time and avoids costly errors later. To get your chart of accounts set up correctly and connected to the right reporting tools, book a free consultation with our experts today.
Frequently Asked Question
Most small businesses need between 20 and 50 accounts to cover their transactions clearly. The right number depends on the complexity of the business, not its size. Too few accounts hide important cost details, while too many make the chart difficult to navigate.
A standard approach uses four or five-digit codes grouped by category: 1000s for assets, 2000s for liabilities, 3000s for equity, 4000s for revenue, 5000s for COGS, and 6000s for expenses. Leaving gaps between numbers makes it easy to add accounts later without restructuring the existing chart.
Yes, a shared chart of accounts works well for businesses with multiple locations, as long as the structure suits all of them. ERP systems like HashMicro apply a standardised chart across entities while still producing separate financial reports for each location or business unit.
Most businesses benefit from reviewing their chart of accounts at least once a year, ideally before the financial year ends. Reviews help remove unused accounts, add new ones for changed activities, and confirm that GST treatments still align with ATO requirements.
An accountant or registered bookkeeper is best placed to design the initial structure, particularly for GST and BAS reporting. Business owners can contribute input on how transactions should be categorised, but a qualified professional should review and approve the final setup.


