









 Limited to 100 registrants
Manufacturers often face production delays, excess inventory, inefficient workflows, and limited visibility of waste, making bottlenecks hard to identify. Value stream mapping (VSM) visualizes the production flow to uncover inefficiencies and improve processes.
Rooted in the Toyota Production System, VSM is widely used as a lean production approach to analyse lead time, cycle time, inventory buildup, and information flow across departments. For Malaysian manufacturers in sectors such as F&B, E&E, and logistics, VSM provides a structured way to map current production conditions before making targeted process improvements
This overview provides a more detailed introduction to value stream mapping, explaining its purpose, how it is used in process improvement, and why it is an important tool for analyzing and optimizing workflows across different industries.
Key Takeaways
VSM maps both material and information flows together, making the seven wastes waiting, overproduction, and excess inventory visible across the entire process, not just within individual workstations.
Before designing any future state, VSM requires measuring takt time, cycle time, and lead time first skipping the current-state map means improvement targets have no baseline.
Heijunka (production levelling) is VSM's most demanding principle, it only works when continuous flow, pull systems, and demand scheduling operate together simultaneously.
Hidden bottlenecks and waste slow down production and inflate costs. Value stream mapping (VSM) maps your full production flow so you can cut delays and improve lead time faster.
What is Value Stream Mapping (VSM)?
Value Stream Mapping is a lean method used to visualize every step involved in delivering a product or service, from the initial request to the final handoff to the customer. It maps the flow of materials and information along with the time each step takes, showing where value is added and where delays or waste build up.
The purpose is to separate the steps that create value from the ones that only add cost or waiting time. By laying out the current process on one page, teams can measure lead time and design a better future state that removes the biggest sources of waste.
The 7 Wastes of Value Stream Mapping (VMS)
In value stream mapping, Muda refers to waste that slows production without adding value to the final product. The table below shows the seven common wastes, how they appear in Malaysian manufacturing, and how VSM helps teams detect them.
| Waste | Definition | Malaysia Manufacturing Example | How VSM Reveals It |
|---|---|---|---|
| Overproduction | Producing more than what is needed, before it is needed. | An E&E factory in Penang produces components ahead of confirmed orders, creating surplus that sits in the buffer zone. | VSM shows push-based scheduling where output exceeds downstream demand. |
| Waiting | Idle time when materials, operators, or machines are not moving. | Finished goods in an F&B facility wait several hours for quality approval before packing can begin. | VSM highlights time gaps between process steps where flow stops completely. |
| Transport | Unnecessary movement of materials or products between locations. | Raw materials in a Selangor automotive parts plant are moved across three separate storage areas before reaching the production line. | VSM traces material flow paths and flags unnecessary travel distance between steps. |
| Overprocessing | Doing more work or using more resources than the product requires. | A packaging line applies two layers of wrapping when one meets the specification. | VSM maps each process step and helps teams question whether each action adds value. |
| Inventory | Excess stock held at any stage of production beyond immediate need. | A food manufacturer holds three weeks of raw ingredients due to poor demand forecasting and manual reorder processes. | VSM shows inventory triangles between steps where stock accumulates beyond required levels. |
| Motion | Unnecessary movement of people or equipment during a task. | Assembly workers in a Johor electronics factory walk between workstations repeatedly to retrieve tools stored away from the line. | VSM captures operator movement and identifies layout inefficiencies that slow cycle time. |
| Defects | Products that fail quality checks and require rework or disposal. | A garment manufacturer in Kuala Lumpur rejects a batch of items due to stitching errors caught only at final inspection. | VSM reveals where defects occur in the flow and how rework loops extend overall lead time. |
How to Create a Value Stream Map 8 Steps
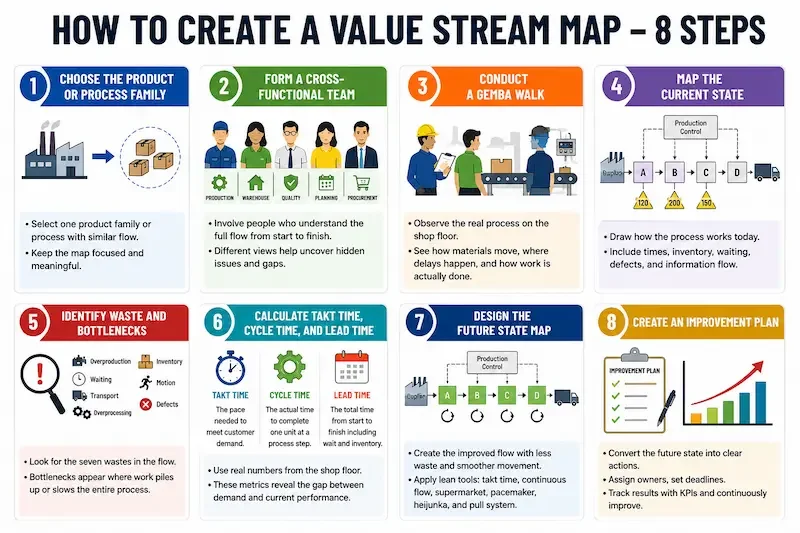
To create a value stream map, choose one production flow, observe the real process, then map the current and future state to identify waste, bottlenecks, lead time, cycle time, inventory, and information flow.
Step 1: Choose the Product or Process Family
Do not start VSM by mapping the whole factory at once. Choose one product family or process group with similar materials, routing, machines, and customer demand so the map stays focused and useful.
Step 2: Form a Cross-Functional Team
A value stream map should involve people who understand the full production flow. Include production, warehouse, procurement, quality, planning, and operations teams so each handoff, delay, and data gap can be reviewed from the real process.
Step 3: Conduct a Gemba Walk
A Gemba walk means observing the actual shop floor instead of relying only on reports or spreadsheets. Teams should watch how materials move, where operators wait, how machines are used, and where inventory builds up between process steps.
Step 4: Map the Current State
The current state map shows how the process works today. Include cycle time, changeover time, inventory levels, waiting time, defect rate, and information flow so the team can see both physical movement and production planning communication in one view.
Step 5: Identify Waste and Bottlenecks
After the current state is mapped, review where the seven wastes appear: overproduction, waiting, transport, overprocessing, inventory, motion, and defects. Bottlenecks usually show up where work piles up, cycle time exceeds demand, or one process slows the entire production flow.
Step 6: Calculate Takt Time, Cycle Time, and Lead Time
Takt time shows how fast production must run to meet customer demand. Cycle time shows how long one process takes to complete its work, while lead time shows the total time from start to finish, including waiting and inventory delays.
Step 7: Design the Future State Map
The future state map shows how the process should work after improvement. Use lean guidelines such as takt time, continuous flow, supermarket, pacemaker process, heijunka, and inventory control methods to reduce waste and create a smoother production flow.
Step 8: Create an Improvement Plan
Turn the future state map into a kaizen plan with clear actions, owners, deadlines, and KPIs. Each improvement should target a specific issue, such as reducing waiting time, lowering inventory buildup, improving quality checks, or shortening lead time.
The 6 Lean Value Stream Design Guidelines
Based on the Lean Enterprise Institute’s explanation of VSM as a way to map material and information flow from current state to future state, these guidelines help teams design a smoother production flow without overcomplicating the process.
| Guideline | In Plain Language | Metric It Improves |
|---|---|---|
| Produce to takt time | Match production speed with actual customer demand instead of producing too fast or too slow. | Demand alignment, output stability, schedule accuracy |
| Continuous flow | Move products from one process to the next with minimal waiting, batching, or interruption. | Cycle time, waiting time, work-in-progress inventory |
| Supermarket pull | Use controlled inventory points so upstream processes only replenish what downstream teams consume. | Inventory level, replenishment accuracy, stock availability |
| Pacemaker process | Set one key process as the main scheduling point to control the rhythm of production. | Production control, throughput, schedule stability |
| Heijunka | Level the production mix and volume to reduce uneven workloads and sudden production spikes. | Workload balance, changeover pressure, planning consistency |
| Initial pull | Release work based on real demand signals instead of pushing jobs into production too early. | Queue time, WIP buildup, lead time |
Value Stream Mapping Examples in Malaysia Manufacturing
The examples below are hypothetical but realistic scenarios to show how VSM can be used in Malaysian manufacturing. They should be treated as practical illustrations, not official case studies or performance claims.
Example 1: F&B Manufacturer in Selangor
An F&B manufacturer in Selangor can use VSM to identify delays in raw material receiving, QC, mixing, packing, and finished goods storage, including waiting time, excess WIP, and late-stage rework.
Example 2: E&E Assembly Supplier in Penang
An E&E assembly supplier in Penang can use VSM to spot waiting waste, large batch delays, testing bottlenecks, and excess inventory buffers before assembly and inspection.
| Metric | Before VSM | After VSM | Improvement |
|---|---|---|---|
| Waiting waste | Components wait between assembly, inspection, and testing due to uneven scheduling. | Work is released based on clearer demand signals and process capacity. | Less waiting between assembly and testing. |
| Batch size | Large batches move through the line, creating queues before inspection. | Smaller, more frequent batches move through the process. | Smoother flow and faster issue detection. |
| Bottleneck | Testing becomes the slowest point and blocks finished output. | The testing process is treated as the pacemaker for production planning. | Better control over throughput and scheduling. |
| Inventory buffer | Extra inventory is held before testing to prevent line stoppages. | Buffer levels are controlled using supermarket pull logic. | Lower excess inventory without losing process stability. |
Value Stream Mapping Symbols Quick Reference
VSM symbols make production flow easier to read by showing process steps, material movement, information flow, inventory, and improvement points in one table.
| Category | Symbol Name | What It Represents | When to Use It |
|---|---|---|---|
| Process | Process box | A production or operational step, such as cutting, mixing, assembly, packing, or inspection. | Use it to show each main activity in the value stream. |
| Process Data | Data box | Key process information such as cycle time, changeover time, uptime, defect rate, or manpower. | Place it below a process box to explain how that step performs. |
| Inventory | Inventory triangle | Stock or work-in-progress waiting between process steps. | Use it when materials, semi-finished goods, or finished goods are stored before moving forward. |
| Material Flow | Push arrow | Materials are moved to the next process without a direct demand signal. | Use it when production is scheduled or pushed based on forecast, not actual consumption. |
| Material Flow | Pull arrow | Materials move only when the next process or customer needs them. | Use it to show demand-based movement or pull system logic. |
| Information Flow | Information flow | Communication, schedule, or planning signals between teams or systems. | Use it to show how production orders, forecasts, or customer demand are shared. |
| External Parties | Supplier / customer | The starting or ending point of the value stream. | Use it to show where materials come from and where finished goods are delivered. |
| Improvement | Kaizen burst | A problem area or improvement opportunity. | Use it to mark bottlenecks, waiting time, rework, excess inventory, or process gaps that need action. |
Value Stream Mapping vs Process Mapping
Process mapping shows process steps, while VSM shows end-to-end flow, waste, time, inventory, and cross-department bottlenecks.
| Criteria | Value Stream Mapping | Process Mapping |
|---|---|---|
| Main focus | End-to-end value flow, including material flow, information flow, waste, time, and inventory. | Step-by-step process activities, decisions, and task sequence. |
| Scope | Broader, usually covering multiple teams such as production, warehouse, planning, procurement, and quality. | Narrower, often focused on one department, workflow, or task. |
| Best used for | Finding bottlenecks, reducing lead time, improving production flow, and eliminating waste. | Understanding how a process works and identifying task-level inefficiencies. |
| Time analysis | Includes takt time, cycle time, waiting time, and lead time. | May include time, but usually not as the main focus. |
| Inventory visibility | Shows WIP, stock buildup, and inventory between process steps. | Usually does not show inventory movement in detail. |
| Waste detection | Highlights waste such as waiting, overproduction, transport, defects, and excess inventory. | Helps identify duplicated steps, unclear approvals, or unnecessary handoffs. |
| Output | A current state map and future state map for improvement planning. | A process flowchart or workflow diagram. |
| Manufacturing example | Used to analyse why finished goods wait too long between production, QC, and packing. | Used to document how a purchase request moves from submission to approval. |
From Manual VSM to Digital Manufacturing
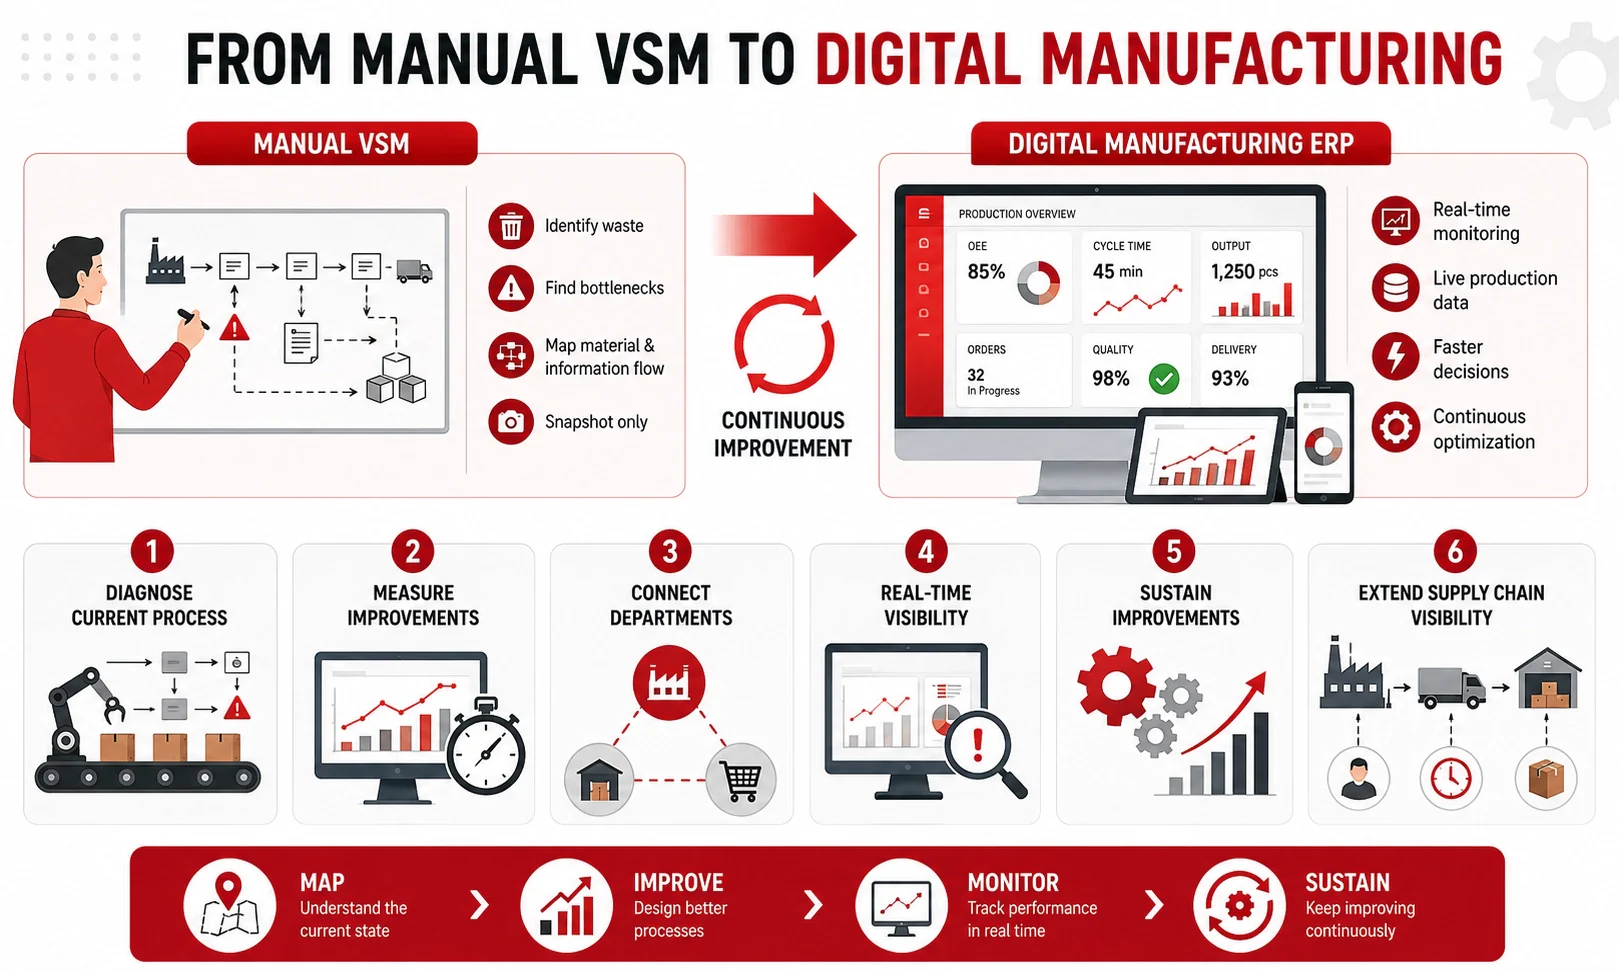
Manual value stream mapping helps identify waste, bottlenecks, and process gaps across production. However, because it captures only a single point in time, it becomes difficult to monitor improvements as production conditions change.
1. Manual VSM helps teams diagnose the current process
It shows how materials, information, and work orders move from one step to another. This makes it easier to identify delays, excess inventory, rework, and handoff issues that may not be visible from standard reports.
2. Digital systems help teams keep improvements measurable
After a future-state map is created, manufacturers need a way to track whether the changes are working in real operations. A manufacturing ERP with manufacturing execution capabilities can monitor cycle time, inventory movement, production schedules, purchase orders, quality issues, and delivery status using updated operational data.
3. Manufacturing ERP connects planning with shop floor execution
Production teams can see whether orders are delayed, warehouse teams can check stock movement, and procurement teams can monitor whether materials are ready for the next production run. This helps each department respond based on the same information.
4. Real-time visibility reduces late reactions
Instead of waiting for manual updates or end-of-day reports, managers can review performance data earlier and detect flow problems before they affect output. Small issues such as material shortages, machine delays, or quality holds can be handled before they become larger production risks.
5. Digital manufacturing makes VSM easier to sustain
VSM gives teams the improvement direction, while ERP systems help maintain control after the mapping exercise is complete. Together, they help manufacturers move from one-time process analysis to continuous monitoring and improvement.
6. Supply chain management extends visibility beyond the factory
Waste and delays often start upstream, so linking VSM improvements with supply chain management (SCM) helps procurement monitor supplier readiness, material lead time, and inbound movement before they disrupt the production schedule.
Map Your Value Stream Then Automate It
A value stream map helps manufacturers understand where waste, delays, and bottlenecks happen. Once the current state and future state are clear, the next step is keeping those improvements visible in daily operations.
This is where ERP can support long-term process control. By connecting production schedules, inventory movement, purchase orders, quality records, and delivery updates, teams can monitor whether the improved flow is being followed.
For Malaysian manufacturers, VSM provides the direction, while digital systems help maintain the discipline. The goal is not only to redesign the process once, but to make improvement easier to track, manage, and sustain over time.
Conclusion
Value stream mapping gives manufacturers a clearer way to see where production flow loses time, capacity, and control. Beyond identifying waste, VSM helps teams align around the same operational picture so production, warehouse, procurement, quality, and planning do not work from separate assumptions.
The real value of VSM comes after the map is created. When teams use it to review decisions, ownership, and daily execution, improvement becomes less dependent on guesswork and more connected to actual shop floor conditions.
For businesses that want to maintain these improvements over time, a free demo can be used to explore how manufacturing ERP connects production schedules, inventory movement, purchase orders, quality records, and delivery updates in one system.
FAQ About Value Stream Mapping (VSM)
The four basic steps are selecting a product family, mapping the current state, designing the future state, and creating a kaizen improvement plan. A gemba walk should support the current state map so the team works from real shop floor conditions.
The seven wastes are overproduction, waiting, transport, overprocessing, inventory, motion, and defects. In VSM, these wastes usually appear as idle time, excess WIP, rework, long movement paths, or delays between process steps.
VSM is mainly a lean manufacturing tool. It can support Six Sigma projects, but its main purpose is to improve flow, reduce muda, and make waste visible across the value stream.
Process mapping shows the sequence of steps inside a process. VSM shows the full value flow, including takt time, cycle time, lead time, inventory, information flow, and bottlenecks across departments.
You need data such as customer demand, cycle time, changeover time, lead time, inventory levels, defect rate, production schedule, and information flow. Teams should also validate this data through direct shop floor observation.
Yes, VSM is useful for Malaysian manufacturers that deal with production delays, excess inventory, quality issues, or logistics flow problems. It is especially relevant for F&B manufacturers in Selangor, E&E suppliers in Penang, and logistics-linked operations connected to major hubs such as Port Klang.