









 Limited to 100 registrants

Enterprise leaders frequently struggle with fragmented data and endless spreadsheets. This makes tracking business health almost impossible. A structured sales report provides decision makers with a consolidated view of their performance. This clarity is essential to guide teams effectively and move beyond basic transaction records.
Moving from raw data to strategic analysis directly drives sustainable growth. According to a recent report by The Edge Malaysia, enterprises must modernise their digital infrastructure to maintain a competitive advantage. Breaking down data silos enables faster decisions and significantly boosts forecasting accuracy.
This article details how to transform scattered numbers into actionable insights. It explores the fundamental elements required to track enterprise performance and sales prospect management accurately, providing a step by step methodology. Furthermore, management teams can directly download ready to use templates to establish a clear reporting framework immediately.
Key Takeaways
A sales report is a comprehensive document that uses raw transaction data to evaluate performance and highlight trends, equipping executive management with the insights needed for strategic decisions.
Deploying various sales report types ensures every stakeholder receives targeted data perspectives, which management can then consolidate into a unified dashboard to establish a single source of corporate truth.
A structured template combined with strategic data interpretation enables management to look beyond basic revenue figures and pinpoint specific operational bottlenecks for future improvement.
Transforming sales data into actual growth requires excellent internal coordination. A transparent operational environment helps leadership maintain clear visibility across all divisions.

What Is a Sales Report?
A sales report is a comprehensive summary of a company's sales activities, results, and overall performance within a specific period. It functions as a strategic health check for your revenue generating departments. Unlike basic financial documents or raw transaction ledgers, this report provides actionable context to your numbers. It is specifically designed to transform raw data into clear and measurable business insights.
This document serves as a vital communication bridge between frontline representatives, finance teams, and executive management. It highlights team performance, guides budget allocation, and offers the C suite a clear view of corporate growth. Furthermore, these reports are highly flexible to meet specific enterprise needs. They can be prepared daily, weekly, monthly, quarterly, or annually to track broad company wide revenue or targeted regional success.
Why Is a Sales Report Important for Businesses?
Tracking business numbers is critical for enterprise growth. Consolidating data from prospect interactions and communication CRM systems in Malaysia communication CRM systems in Malaysia provides management with an accurate view of team productivity, making a robust reporting structure indispensable.
Tracks Performance Against Targets
A well structured report allows business leaders to compare actual generated revenue against predefined targets. This continuous comparison reveals whether your sales strategies are effectively working. By reviewing these metrics regularly, leaders can spot underperformance early in the quarter. This proactive visibility provides essential time to adjust tactics and implement targeted coaching before revenue goals are missed.
Identifies Revenue Trends and Opportunities
A deep dive analysis into your sales data reveals invaluable performance breakdowns across your enterprise. Segmenting data by product line, territory, or customer segment uncovers hidden revenue trends. For example, a product might sell exceptionally well in Kuala Lumpur but struggle elsewhere. These specific insights allow management to drive strategic upselling and cross selling campaigns to maximise returns.
Supports Better Forecasting and Decisions
Strategic business growth relies heavily on predictability and accurate revenue estimation. Combining historical data with active opportunities in your pipeline generates highly accurate forecasts. Knowing what revenue is likely to close soon connects directly to broader enterprise planning. This dictates how marketing budgets are allocated, when new staff should be hired, and how corporate strategy must evolve.
Common Types of Sales Reports
Within a large organisation, different stakeholders require different perspectives on the data. A frontline representative needs immediate tactical data, while a Chief Financial Officer requires long term strategic trends. Because different reports serve entirely different purposes across the enterprise, management must understand which format to deploy based on the following eight common types, their primary purposes, and their target audiences:
management must understand which format to deploy based on the following eight common types, their primary purposes, and their target audiences:
management must understand which format to deploy based on the following eight common types, their primary purposes, and their target audiences:
management must understand which format to deploy based on the following eight common types, their primary purposes, and their target audiences:
management must understand which format to deploy based on the following eight common types, their primary purposes, and their target audiences:
management must understand which format to deploy based on the following eight common types, their primary purposes, and their target audiences:
management must understand which format to deploy based on the following eight common types, their primary purposes, and their target audiences:
| Sales Report Type | Primary Purpose | Primary Audience | Key Information Included |
|---|---|---|---|
| Daily Sales Report | Tracks day-to-day sales activity. | Frontline Sales Reps & Managers | Daily revenue, transactions, orders, and sales activities. |
| Weekly Sales Report | Reviews short-term progress and pipeline. | Sales Managers | Weekly sales results, target progress, open deals, and key issues. |
| Monthly Sales Report | Evaluates overall monthly performance. | VP of Sales & Finance Leaders | Revenue, target achievement, team performance, and product results. |
| Sales Pipeline Report | Monitors opportunities across the cycle. | Sales Ops & Managers | Deal stages, pipeline value, probability, and potential closings. |
| Sales Performance Report | Compares outcomes across teams/areas. | Management | Results by representative, territory, channel, or business unit. |
| Sales Forecast Report | Estimates future revenue based on data. | C-Level Executives | Historical trends, active deals, and expected revenue. |
| Product Sales Report | Identifies revenue-driving products. | Marketing & Product Teams | Sales volume, revenue, and performance by product or category. |
| Annual Sales Report | Evaluates yearly corporate growth and guides upcoming strategic budgets. | C Level Executives and Finance Directors | Annual revenue comparisons, total pipeline generated, and macro performance trends. |
While these individual reports are highly valuable on their own, modern enterprises often leverage ai for sales data analytics to combine these specific metrics into a single unified dashboard. This consolidation provides real-time visibility, ensuring that every department is operating from a single source of truth.
How to Create a Sales Report
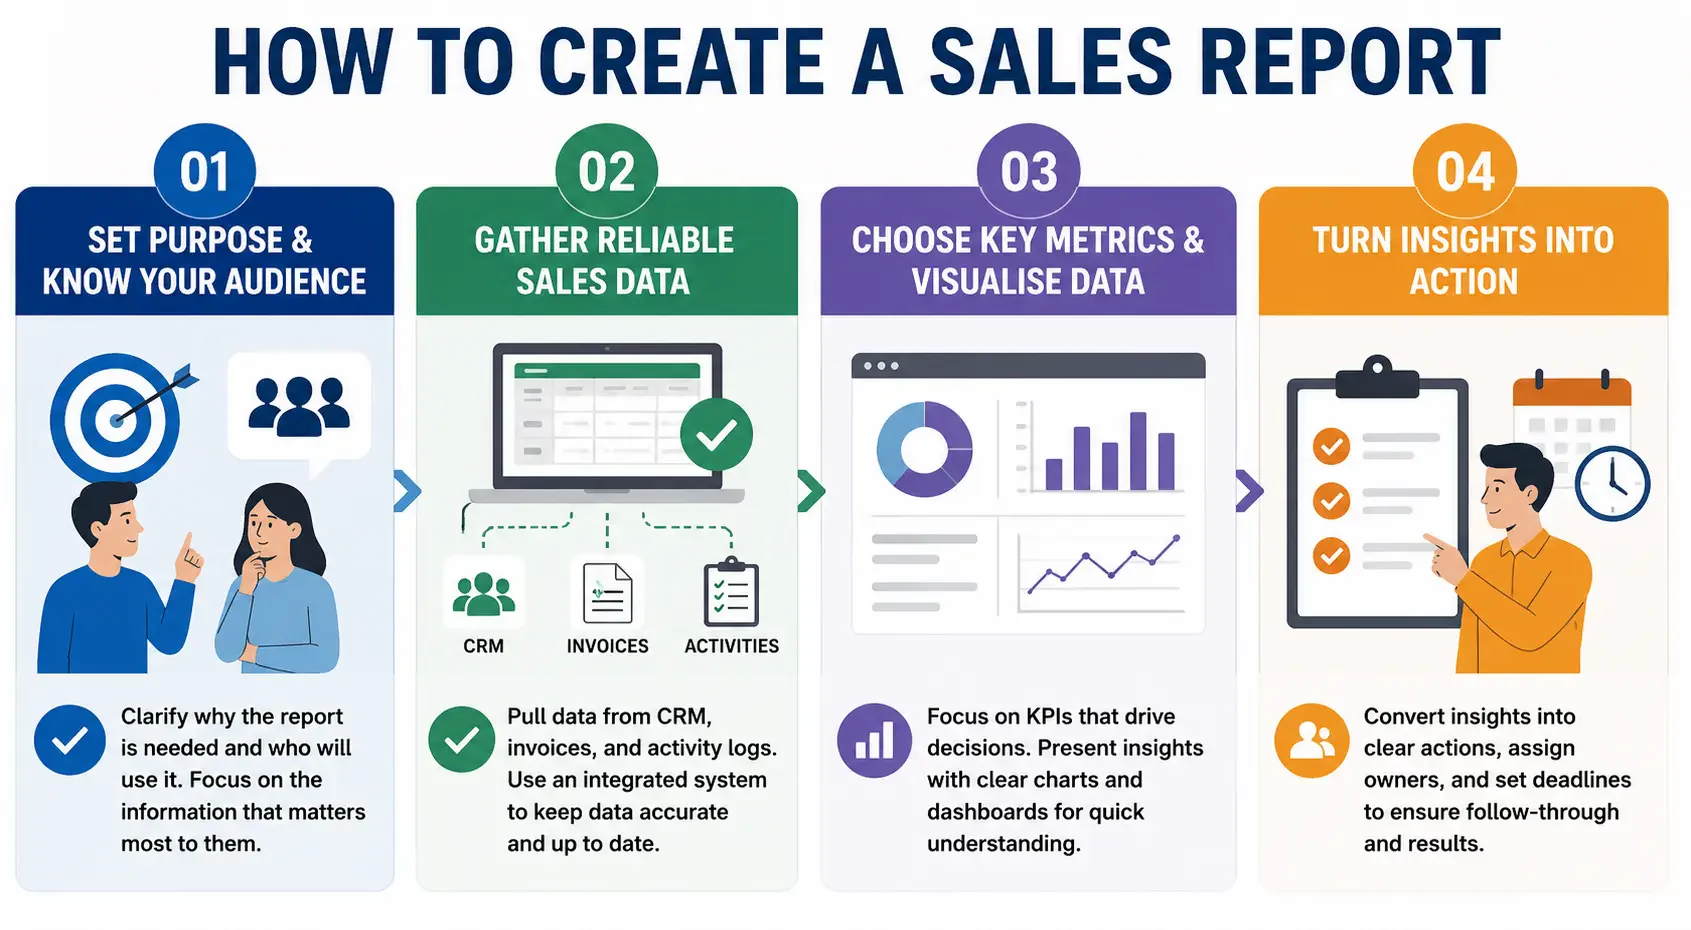
Building a report that commands attention and drives change requires a methodical approach. Follow these four critical steps to build an effective reporting structure.
1. Define the Reporting Purpose and Audience
Before gathering data, determine why the report exists and who will read it. Report frequency depends entirely on the end user. A frontline manager needs tactical updates, whereas financial officers care about pipeline value and revenue. Tailor metrics strictly to your audience to prevent information overload.
2. Collect Accurate Sales Data
Consolidating data from CRM platforms, pending invoices, and activity records is often challenging for growing enterprises. The goal is to collect this information without introducing manual errors. Scaling organisations should move toward the best crm software system architecture as a unified platform to ensure all pulled data remains completely accurate and up to date.
3. Select Relevant Metrics and Visualise Insights
Focus on decision driving metrics rather than vanity numbers. Choose key performance indicators that align directly with your business goals. Avoid presenting endless spreadsheet rows by utilising visual dashboards with clear charts. Visualisation helps executives spot trends at a glance and makes data infinitely more digestible.
4. Review Findings and Assign Actions
A report is only as good as the action it inspires. Once data is visualised, leadership must translate raw figures into actionable next steps. Assign clear ownership to these tasks and set strict deadlines for follow up to ensure accountability across your enterprise team.
Ready to Use Free Sales Report Templates
Using a ready made template saves time and makes sales reporting highly consistent. The following templates cover common reporting needs, from daily activity tracking to long term forecasting, and can be customised for different enterprise sizes or industries:
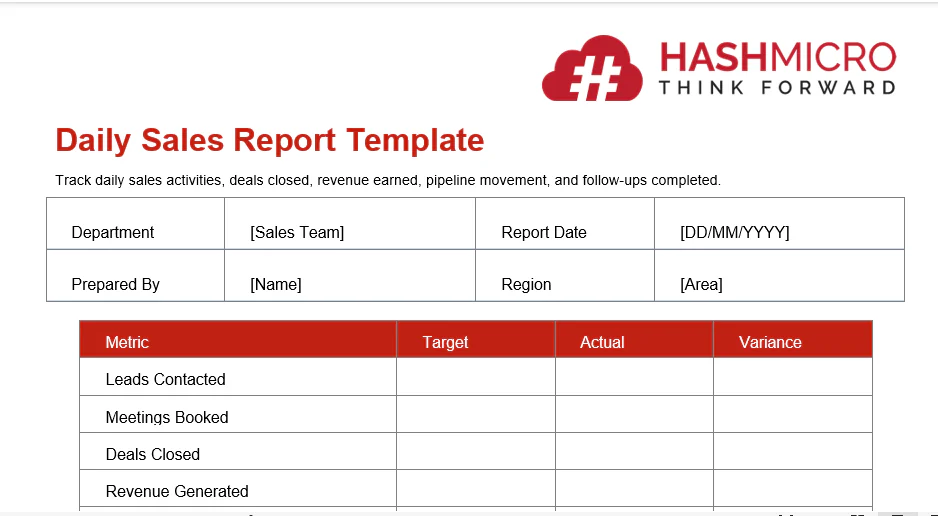
1. Daily Sales Report Template
Use this template to track daily sales activities, deals closed, revenue earned, and follow ups completed. It is ideal for frontline representatives and managers to monitor productivity and short term progress.
2. Weekly Sales Report Template
This document summarises weekly sales performance and pipeline movement. It is commonly used during team review meetings to assess target progress, identify open deals, and determine operational priorities.
3. Monthly Sales Report Template
A monthly template gives management a broader view of revenue, sales trends, and overall team performance. It is highly useful for calculating commissions, evaluating target achievement, and conducting monthly strategic reviews.
4. Sales Pipeline Report Template
A pipeline template tracks active opportunities at each stage of the sales cycle. It helps leaders evaluate sales pipeline value, assess closing probabilities, and identify operational delays quickly.
5. Sales Performance Report Template
This template compares outcomes across different representatives, territories, or business units. It supports management in executive coaching, performance evaluations, and strategic incentive planning.
6. Sales Forecast Report Template
A sales forecast template estimates expected future revenue using historical trends and current active deals. It helps C level executives and finance leaders plan budgets and allocate corporate resources effectively.
7. Product Sales Report Template
Use this template to break down sales volume and revenue by specific product lines or categories. It allows marketing and product teams to identify top performing items, uncover hidden revenue trends, and adjust inventory strategies accordingly.
8. Annual Sales Report Template
Use an annual template to summarise full year sales results and prepare for future corporate planning. It is especially useful during end of year financial reviews to evaluate macro performance trends and set upcoming revenue targets.
Management teams can access the complete collection of free sales report templates below to standardise internal tracking immediately. Select the required format to transform raw data into strategic insights without building analytical frameworks from scratch.
This file contains a complete set of sales report templates.
A Practical Sales Report Example & Template Structure
To visualise how these metrics come together, let us look at an illustrative monthly format tailored specifically for a B2B enterprise sales team operating in the Malaysian market.
| Metric | July 2026 | Target | Achievement |
|---|---|---|---|
| Total Sales Revenue | RM1,250,000 | RM1,400,000 | 89.3% |
| Deals Won | 28 | 32 | 87.5% |
| Average Deal Size | RM44,643 | RM40,000 | 111.6% |
| Pipeline Value | RM3,800,000 | — | — |
| Pipeline Conversion Rate | 24% | 28% | 85.7% |
Strategic Interpretation:
While total revenue of RM1,250,000 missed the target at an 89.3% achievement rate, the average deal size of RM44,643 exceeded expectations by 11%. This indicates the team secures higher value contracts despite closing fewer deals. Management must evaluate middle funnel bottlenecks and track delayed enterprise deals to close the remaining revenue gap next month.
What Should Be Included in a Sales Report?

A sales report must contain specific critical metrics to function as a strategic tool rather than a confusing data dump. Every effective enterprise report should cover three primary areas.
- Sales Revenue and Target Achievement: This baseline states the reporting period, total generated revenue, predefined targets, and final achievement percentage. This instantly answers whether your team successfully hit their numbers.
- Deal and Performance Breakdown: Look beyond revenue to understand how it was achieved by tracking deals won versus lost and average deal size. Include sales cycle length and win/loss ratios to identify where deals stall, allowing management to remove friction.
- Pipeline, Forecast, and Next Actions: Reports must look forward by detailing what is sales crm pipeline value, conversion rates, and forecasted revenue. Always conclude with key findings, identified risks, and strategic recommended actions, because data without action is useless.
Common Challenges in Sales Reporting
Enterprises frequently encounter hurdles when implementing reporting structures. Understanding these common pitfalls is the first step toward building a reliable and actionable data ecosystem for your organisation.
Poor Data Hygiene
If frontline representatives fail to update deal stages accurately or enter incorrect values, the integrity of the entire executive report is ruined. Accurate strategic reporting relies entirely on precise data entry. The familiar rule of garbage in and garbage out applies heavily here.
Manual Process Bottlenecks
Relying on manual spreadsheets inevitably leads to version control issues and broken formulas. Furthermore, conflicting metric definitions across departments cause massive internal misalignment. Sales and marketing teams must completely agree on terminology to avoid operational confusion.
Delayed Reporting Cycles
Timing is everything in enterprise business operations. Delayed reporting cycles mean data often arrives too late for leadership to influence the quarterly outcome. By the time management reviews the figures, the opportunity to pivot or coach struggling representatives has already passed.
Achieving Technological Maturity
The solution to these widespread challenges lies in modern technology. Understanding the core flow of erp vs crm data structures within an integrated system allows businesses to completely eliminate data silos and automate tedious consolidation processes. This modernisation strictly enforces data hygiene protocols and provides real time executive visibility.
Conclusion
The true value of enterprise reporting goes beyond merely reviewing past performance. Modern organisations use consolidated data to anticipate market shifts early. This predictive power allows leadership to pivot proactively instead of reacting to lost deals. Mastering your data ecosystem turns raw hindsight into a definitive tool for future dominance.
Transparent data visibility also fundamentally transforms corporate culture. Operating from a single source of truth eliminates friction and fosters absolute accountability. Financial officers and frontline directors can finally speak the exact same language. This structural alignment ensures every operational move supports broader enterprise revenue goals.
Transitioning to automated reporting requires understanding available technology first. Exploring how platforms consolidate raw figures helps leaders gauge technological readiness. A free demo provides a practical environment to observe these frameworks operating in real time. This educational experience helps evaluate system capabilities before completely restructuring your data infrastructure.
FAQ About Sales Reports
Executive leaders use consolidated data to identify exactly where prospects abandon the buying journey. By analysing stalled deals and pipeline velocity, directors can pinpoint systemic operational flaws early. This proactive visibility allows management to implement targeted coaching before minor inefficiencies compound into massive quarterly losses.
The most valuable yet frequently ignored metric is the average sales cycle length compared against win rates. Understanding how long a successful deal takes helps leaders identify immediate anomalies in the active pipeline. If deals sit in the negotiation stage longer than your historical average, management knows exactly where to intervene.
Static documents capture a single moment in time which makes them instantly outdated the second they are exported. Scaling enterprises require real time visibility to make agile decisions in a fluctuating market. Relying on manual files inevitably leads to version control chaos and severely delayed strategic pivots.
Forcing representatives to manually compile weekly figures actively pulls them away from generating revenue. Automated systems eliminate this administrative burden entirely while ensuring absolute data accuracy across the board. This structural shift reclaims countless working hours allowing your team to focus exclusively on closing high value enterprise contracts.
Precise data allows executive teams to distribute enterprise budgets based on factual performance rather than basic intuition. If a specific regional territory shows a consistently high conversion rate, management can immediately reallocate marketing spend there. This strategic alignment ensures financial resources are deployed exclusively to optimise the most profitable market opportunities.