


Sales reporting can feel challenging, especially when you need to manage team performance while ensuring leadership receives accurate numbers. Without a structured process, compiling data from different sources can take time.
Because of this, many businesses look for more efficient ways to organize and analyze sales information. Using simple reporting tools or standardized templates can reduce manual work and help teams focus on understanding performance trends.
When sales data is organized properly, reporting becomes faster and more reliable. This allows managers to evaluate results more confidently, identify opportunities for improvement, and plan future sales strategies with better clarity.
Table of Contents
Key Takeaways
|
What is a Sales Report?
A sales report, or sales analysis report, is a document that shows your sales activities and results over a set period. It usually includes details like the number of leads, new customers gained, revenue earned, and overall sales performance.
This report helps sales managers and stakeholders track team performance, identify problems in the sales process, and make better business decisions. It can also highlight strategies for growth and define the company’s ideal customers.
Why is a Sales Report Important?
Sales reports provide valuable insights into performance, help identify opportunities, and guide strategic decision-making. They turn raw data into actionable intelligence and track the data.
With this foundation, let’s explore why sales reports are essential for success.
1. Spot Trends That Matter
When you track enough sales data, patterns will start to emerge. This is called sales trend analysis, and it’s a game-changer for businesses looking to grow and adapt.
For example, you can use sales data to:
- Improve your product or service offerings by identifying what customers are actually buying.
- Predict seasonal spikes or slowdowns so you’re not caught off guard.
- Adjust staffing or resources during busy periods to meet demand without stretching your team too thin.
Sales trend analysis doesn’t just help you look back at what worked—it helps you plan for what’s ahead. It’s like turning your sales data into a roadmap for success.
2. Make Smarter Decisions
Let’s face it: decisions based on guesswork or emotions don’t cut it. Sales analysis gives you hard facts to answer key business questions like:
- What’s our best-selling product, and why does it perform so well?
- When do we generate the most revenue? Is it a specific season, month, or even day of the week?
- Which sales channels (online, in-store, or social media) generate the most revenue?
- How is our sales team performing quarter by quarter?
Accurate data to back up your decisions helps you make better choices and builds trust within your team. When everyone sees decisions based on data rather than guesswork, it strengthens morale and creates a shared sense of direction.
3. Drive Growth That Lasts
Sales analysis isn’t just about numbers—it’s about understanding what makes your business tick. By diving into your data, you can figure out:
- What your customers love (and what they don’t).
- Where the market is headed and how you can stay ahead.
- Which parts of your operations are efficient and where you’re losing money.
This insight lets you fine-tune your strategies so that your business grows profitable and sustainable. Instead of guessing where to invest time and money, you’ll have a clear idea of what’s working and what needs improvement, paving the way for steady.
Also read: What is BIR eSales and How It Simplifies Tax Filing
How to Write a Sales Report
Crafting a sales report that effectively communicates key data without boring your audience is no small task. It requires clarity, focus, and a touch of creativity. Here are five steps to help you create a sales report that informs and drives action:
1. Define the Purpose of Your Sales Report
Your report’s goal is to present essential sales metrics—but not every piece of data needs to be included. Instead, hone in on the information that aligns with specific objectives.
Ask yourself: What is the report meant to accomplish? Are you evaluating the success of promotional campaigns? Identifying sales trends to inform forecasts? Motivating your team to hit their targets? Or providing sales KPIs to guide operational decisions?
Clarifying your purpose will help you determine what data to include and the scope of your report, such as the time period covered.
2. Understand Your Audience
Consider who will be reading it once you’ve pinpointed the report’s purpose. Tailor the report to address what matters most to your audience.
For instance, a marketing leader may want insights into which campaigns generated the most revenue, while a sales director is more concerned with quota attainment. Executives and decision-makers, on the other hand, prefer a high-level overview that focuses on company growth.
3. Collect and Organize Sales Data
With a clear purpose and audience in mind, the next step is gathering, filtering, and analyzing your sales data. This process should be intentional and seamless: leveraging tools that integrate with your lead management software, CRM, or sales management software can save time.
Start by identifying the metrics you want to include. Typical sales reports highlight key performance indicators (KPIs), team productivity, product sales, revenue retention, net sales, profits, and customer acquisition costs.
Clean up your data to eliminate duplicates and ensure accuracy. For example, if your report targets regional sales, exclude international figures. Be sure to specify the time frame you’re analyzing, such as monthly or yearly comparisons, to provide meaningful context.
4. Use Visuals to Emphasize Key Metrics
No one enjoys a presentation full of dense text or endless spreadsheets. Visual elements like charts and graphs make data more accessible and engaging. Consider these examples:
- Line graphs: Show revenue trends over time.
- Pie charts: Highlight each product’s contribution to total sales.
- Bar graphs: Compare employee performance or regional results.
Data visualization clarifies complex information and highlights critical trends and areas for improvement. Tools like Google Data Studio can help you create polished visuals to enhance your report.
A SWOT analysis can help pinpoint root causes and suggest solutions if your report addresses challenges.
5. Provide Context and Insights
Data without context can be misleading and lead to poor decisions. Always interpret the numbers to explain their significance.
Instead of just presenting figures, provide an analysis of what they mean. For example, highlight whether a revenue dip is seasonal or indicative of a broader issue. Discuss actionable insights that can inform future strategies or address areas needing improvement.
Adding this layer of explanation ensures your audience understands the data and can make informed decisions based on it. Ensure that your sales report can also be integrated with an accounting system for easier data tracking.

10 Free Sales Report Templates (Available in Excel & G-Sheet Format)
Sales reports come in various formats to suit different business needs and reporting goals. They help track performance, identify trends, and provide insights for strategic decision-making. Below are sales report example you can use to improve your processes.
1. Daily Sales Report Template
Daily Sales Report Template
This easy-to-use spreadsheet template is perfect for tracking daily sales. In the inventory tab, list your products, prices, and descriptions. In the main template, select a product from the dropdown menu in Item No. column for each row.
Input the quantity sold and tax rate; the template will automatically calculate the total sales amount, including tax. Your daily sales total will appear at the top, giving you a quick performance overview.
2. Weekly Sales Report Template
Weekly Sales Report Template
This template is perfect for sales representatives to track their weekly sales activity efficiently. Start by filling in the number of calls made, visits completed, leads generated, and deals closed for each day.
Don’t forget to include your daily revenue goals and the amounts collected. As you input your data, the template will automatically calculate daily and weekly totals for activities and revenue.
3. Monthly Sales Report Template
Monthly Sales Report Template
This sales report example provides a clear overview of your sales performance for the entire month. Track essential metrics like revenue, number of deals closed, sales by product or region, and team productivity to measure progress and identify opportunities for improvement.
4. Quarterly Sales Report Template
Quarterly Sales Report Template
This sales report sample offers a detailed view of the year’s monthly and quarterly sales performance. Track key metrics such as the number of contacts in your pipeline, conversion rates, units sold, and total sales value for each quarter.
5. Annual Sales Report Template
Annual Sales Report Template
This sales analysis report template makes tracking quarterly sales growth for products, regions, and salespeople simple and effective. Compare estimated versus actual sales side-by-side for each quarter to identify gaps and opportunities.
Just input your product names and sales amounts, and watch as the color-coded bar charts bring your data to life, making insights easy to spot and act on.
6. Weekly Sales Call Report Template
Weekly Sales Call Report Template
This template helps you track weekly sales call activity and outcomes. Monitor key metrics such as the number of calls made, deals initiated and sales closed, giving you insights into your team’s performance and areas to focus on for the upcoming week.
7. Daily Sales KPI Template
Daily Sales KPI Template
This sales report sample is designed to help you track daily key performance indicators (KPIs) over a month. Monitor revenue, customer numbers, and average order value growth with an interactive bar chart that brings your data to life.
With KPIs displayed for each day, you can easily evaluate daily and monthly trends and changes. Simply enter your data into the unshaded sections of the spreadsheet, and the template will automatically generate a dynamic dashboard chart along with monthly KPI averages.
8. Sales Tracking Report Template
Sales Tracking Report Template
This sales tracking report template gives you both a detailed breakdown and a clear financial overview. Start by listing key details in the spreadsheet, such as item costs, markup percentages, quantities sold, and returns.
Watch as the dashboard comes to life, showing profit per item, total income across all products, and a percentage breakdown of revenue by product. It’s an interactive way to track sales and understand which items contribute most to your success.
9. Reasons for Loss Deal Template
Reasons for Loss Deal Template
Understanding why deals are lost is key to spotting patterns and improving your sales strategy. This template makes it easy with two dynamic charts—one breaking down loss reasons by value and the other by count.
Simply input the reporting period’s start and end dates, customize the loss reasons, and add your sales data. Instantly get a clear snapshot of lost deals and actionable insights to refine your approach.
10. Sales Forecast Tracker
Sales Forecast Tracker Template
This Sales Forecast Template helps you estimate and track sales revenue for multiple products across several months. It is designed to provide clear insights into sales performance, broken down by product name, price per unit, units sold, and total revenue.
To use this template, list your products in the Product Name column. For each month, input the price per unit and the expected/actual units sold. Then, review the Total rows to analyze your sales forecast and identify trends.
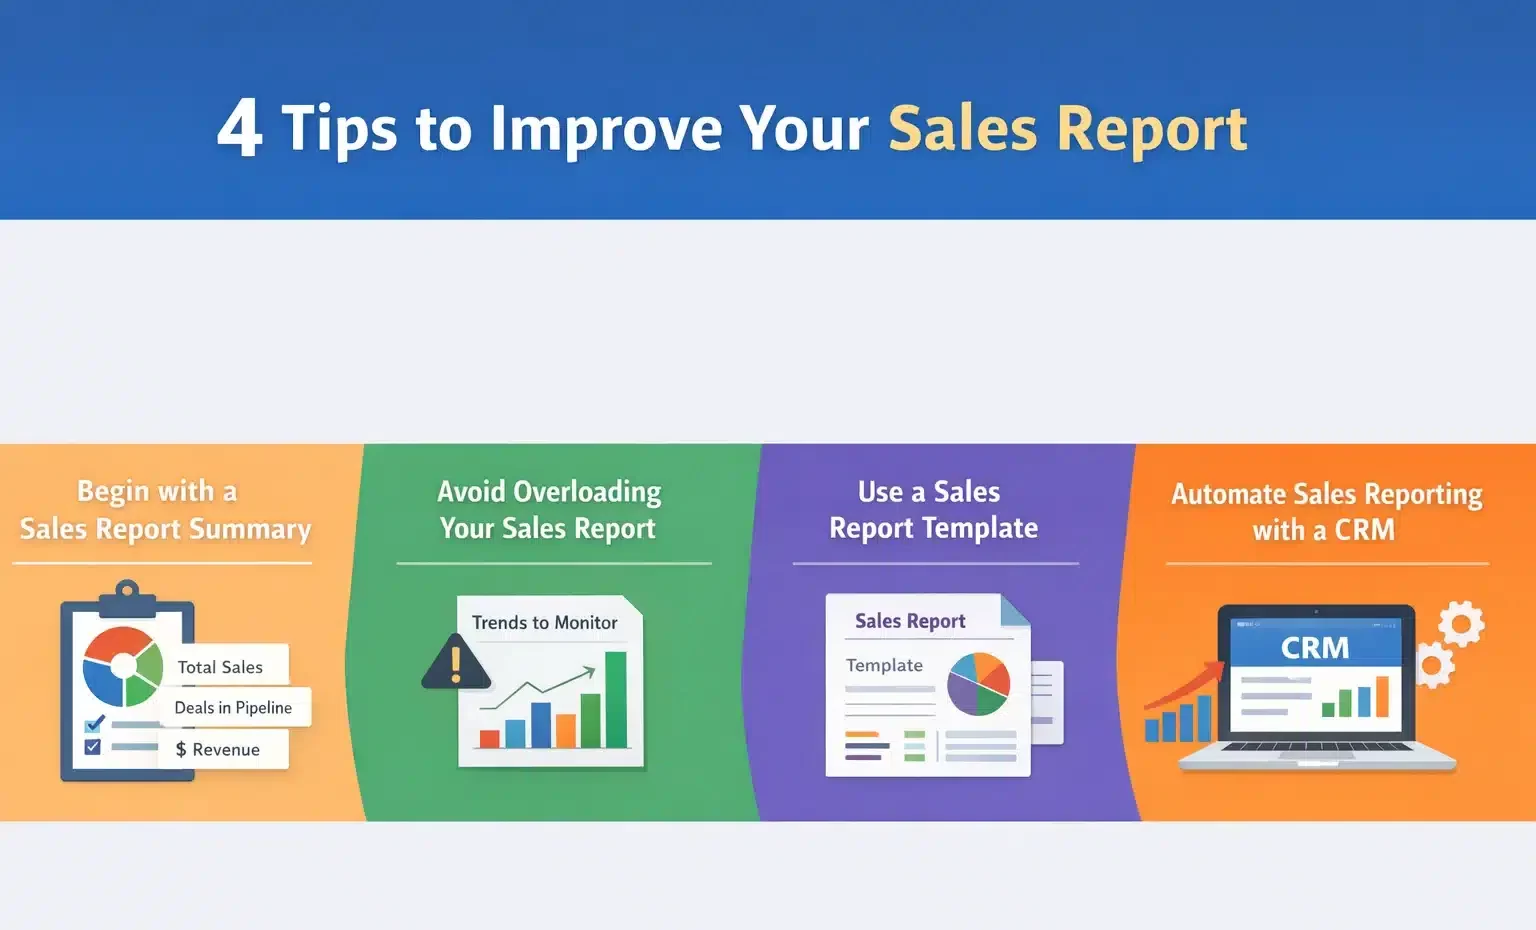
4 Tips to Improve Your Sales Report
Whether you’re a small business using a basic CRM or a large enterprise with extensive resources, the steps outlined above will help you create an effective sales activity report.
But if you want your report to stand out, go beyond the basics. These additional strategies will help you deliver actionable insights quickly and make a strong impression on your audience (and your boss!).
1. Begin with a Sales Report Summary
Starting your report with a summary is key to making it impactful. Much like an executive summary in a business report, it provides decision-makers with a quick overview of the most important data.
Highlight the key findings and takeaways from your report:
- What data are you presenting?
- Why does it matter?
- What are the implications?
Use top-level sales metrics to summarize the report and set expectations. Examples of metrics to include are:
- Total number of sales
- Total sales volume
- Deals currently in the pipeline
- Total revenue
If you’ve identified significant opportunities or challenges, mention them here as well to grab your audience’s attention and prepare them to dive deeper into the details.
2. Avoid Overloading Your Sales Report
Including too much information can overwhelm your audience. Instead of cramming every piece of data into your report, focus on what’s most relevant to your audience. Tailor the data to their needs and, if necessary, create separate reports for different teams or departments.
Struggling to cut down the content? Consider adding a “Trends to Monitor” section at the end of the report. Use this section to list metrics or patterns you’re keeping an eye on, along with their potential long-term impact.
3. Use a Sales Report Template
Consider using a pre-made template if designing and formatting a sales report from scratch isn’t feasible. Templates offer two key advantages:
- They provide a well-organized framework where you can simply input your data and details.
- They save time and effort while ensuring your report remains visually appealing and structured.
With a ready-made template, you can focus more on the data and insights rather than the formatting.
4. Automate Sales Reporting with a CRM
If your business uses customer relationship management (CRM) software, it can simplify the process of generating detailed and customized sales reports.
While traditional tools like Microsoft Excel or Google Sheets are effective for data storage and calculations, they often require manual setup, including formulas and formatting, which can be time-consuming.
CRMs, on the other hand, track and store sales data in real time, which allows you to generate reports quickly. Whether you’re a startup or a small business looking to improve your metrics, leveraging a sales CRM instantly helps you create insightful, data-driven reports and other documents.
With CRM tools, you can:
- View data for any specific period.
- Set custom date ranges for analysis.
- Compare performance across different periods.
- Evaluate the productivity of your sales team.
Automating your reporting process will save time and effort while producing professional reports that clearly and effectively convey critical information. Most CRMs also offer multiple customizable reporting options.
Conclusion
A sales report is more than just a collection of numbers; it helps businesses evaluate performance and make better decisions. With clear and consistent reporting, companies can understand what drives revenue and where improvements are needed.
Using digital tools to manage sales data can simplify reporting processes, reduce manual errors, and provide real-time insights. This allows teams to focus on strategy and customer relationships instead of spending excessive time compiling spreadsheets.
By improving how sales data is tracked and analyzed, businesses can strengthen planning and overall performance management. Consider starting with a free consultation to explore how better reporting systems can support smarter decision-making and long-term growth.
Frequently Asked Questions
-
What is a sales report template and why should I use it?
A sales report template is a pre-formatted document that helps organize sales data into clear, structured reports. It allows teams to track key performance indicators (KPIs), monitor trends, and summarize results efficiently.
-
How do I use these free sales report templates effectively?
To use a template, start by inputting your sales data into the designated sections such as total sales, revenue, deals in the pipeline. Update graphs and charts to reflect your metrics, and tailor the report to your audience, whether it’s management, sales teams, or clients.
-
What are the benefits of using a sales report template for my business?
Sales report templates help simplify reporting, improve accuracy, and make data analysis faster and more insightful. They enable businesses to identify trends, measure team productivity, forecast future sales, and make informed decisions.