










 Limited to 100 registrants

Inventory problems are not new for Filipino businesses. Unused stock piles up, items go unsold, and before you know it, they have expired or become unusable. That is money down the drain, and it sounds familiar, right? If you are in food manufacturing, this is a total nightmare. A study from PIDS even showed that the Philippines wastes around 2,000 tons of food every single day, much of it tied to poor stock visibility.
Based on so many problems caused by bad inventory management, this article will show you how important an inventory aging report is and the easiest way to do it from your home without so many steps.
Key Takeaways
Aged report sorts stock by age to improve sales strategies and efficiency.
Inventory aging reports help identify outdated products and enhance financial health.
Accurate inventory aging report calculation is a key to better inventory control.
Using the right inventory management tools helps automate report generation and improves overall stock control accuracy.
Understanding Inventory Aging Reports
An inventory aging report provides insights into inventory status, showing how long each item stays in storage before being sold or used. It categorizes inventory into time brackets (e.g., 0-30 days, 31-60 days, 61-90 days) based on how long items have been in the warehouse.
This type of inventory report helps companies identify slow moving stock or outdated stock, so they can take actions, such as offering discounts or adjusting purchasing strategies to optimize inventory levels and reduce storage costs.
Furthermore, an inventory aging report supports businesses in maintaining optimal stock levels by providing insights into product demand trends. Regularly analyzing this aged report enables companies to adjust their inventory strategies, preventing overstocking or understocking issues. Businesses that still rely on periodic stock counts can compare their process with a periodic inventory system before moving to real-time tracking.
Why Inventory Aging Reports Matter for Your Business

Inventory aging reports offer multiple benefits that can greatly enhance your business operations. Here are some of the key benefits to explore:
- Identify slow moving inventory: The report highlights items that are not selling well, allowing you to take action, such as offering discounts or promotions.
- Sales and inventory mismatch: It reveals any gaps between your sales data and inventory, helping to pinpoint inefficiencies.
- Manage dead stock: The report aids in strategizing how to handle dead stock through bundling, clearance sales, or special promotions.
- Reduce carrying and overhead costs: By identifying excess stock, you can lower storage expenses and free up capital for other opportunities.
- Improve cash flow: Aging inventory can tie up liquidity, and reducing it allows for better financial flexibility and higher margins.
With better inventory visibility, businesses can make more informed decisions and maintain optimal stock levels.
The Advantages and Disadvantages of Inventory Aging Report
An inventory aging report is a critical tool for assessing the status of your stock. However, like any analytical resource, this inventory report presents benefits and potential drawbacks. Evaluating these advantages and disadvantages is essential to maximize its effectiveness in supporting your business operations.
Advantages:
- Evaluates how long products remain in inventory.
- Highlights the slow moving items that require attention.
- Enhances decision-making for future inventory purchases.
- Assesses the expenses involved in maintaining inventory quality.
Disadvantages:
- Provides limited visibility into overall inventory costs.
- Does not identify which products move the slowest through the inventory cycle.
- Lacks insight into which items incur the highest inventory related expenses.
- This may lead to increased costs for preserving inventory quality.
How to Calculate Aging Inventory
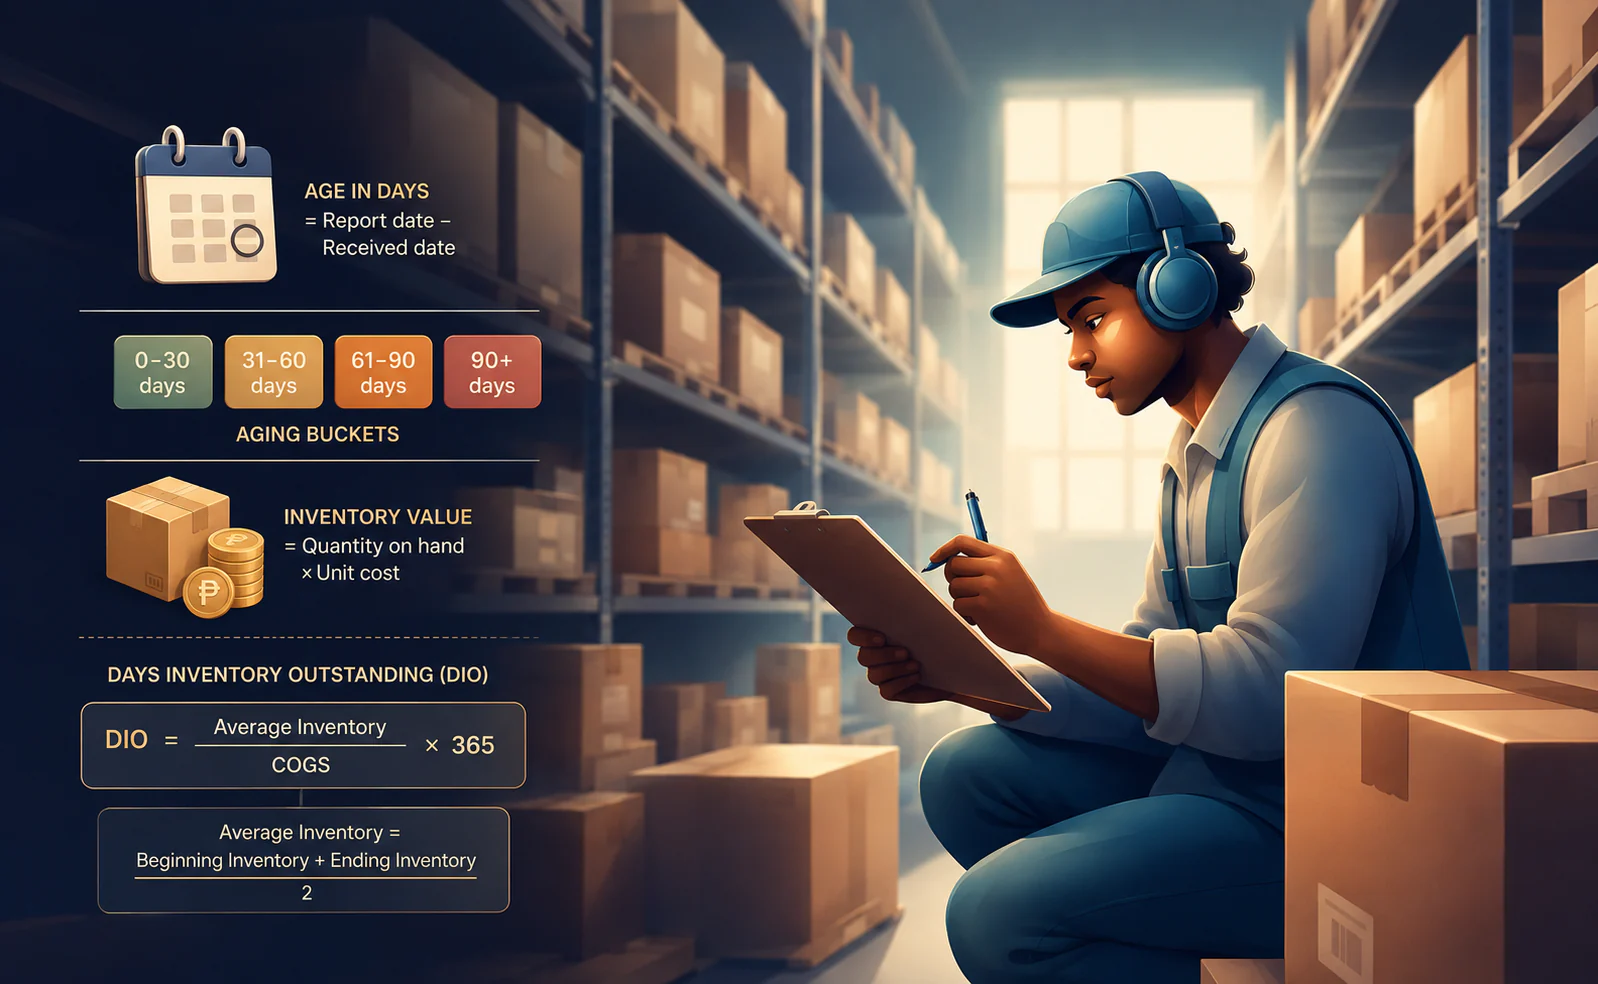
Understanding how to calculate aging inventory and implementing a periodic inventory system can help streamline stock management and improve business efficiency. Here are the keys to an inventory aging report calculation for creating a good inventory report:
1. Calculate the age of each SKU
Inventory aging is measured per item or per batch, not for the warehouse as a whole.
Age in days = Report date - Received date
Example: A batch of frozen chicken received on 10 July 2026 and measured on 18 August 2026 is 39 days old. If the same SKU arrived in several deliveries, treat each batch as its own line so the ages stay accurate.
2. Assign each item to an aging bucket
Group every line into: 0-30; 31-60; 61-90, and 90+ days
For perishable goods, often need tighter brackets, for example 0-15 and 16-30 days.
3. Calculate the value held in each bucket
Inventory value = Quantity on hand x Unit cost
Total the inventory value inside each bucket. This is the number that matters to finance because it shows exactly how much working capital is sitting in stock older than 90 days.
Optional: Days Inventory Outstanding as a supporting KPI
DIO measures how long stock sits in your business on average. It is a company-level indicator, not a replacement for the aging report.
Average inventory = (Beginning inventory + Ending inventory) / 2 DIO = (Average inventory / COGS) X 365
Example: With an average inventory of ₱10,000,000 and annual COGS of ₱30,000,000, DIO is 122 days. Use DIO to track the trend quarter over quarter, and use the aging report to decide what to do with specific SKUs this week.
Businesses can also calculate days sales in inventory to measure how efficiently stock turns into sales.
Inventory Aging Report Example or Calculation
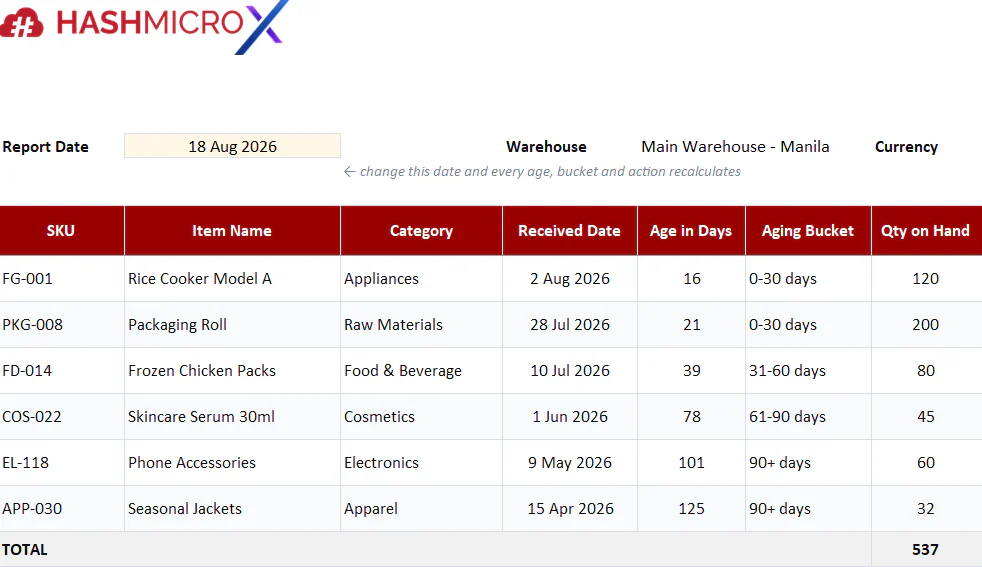
Here is a sample report for a Philippine retailer, dated 18 August 2026. Each row is one SKU, and the aging bucket comes from the number of days since that stock was received.
| SKU | Item Name | Category | Received Date | Age in Days | Aging Bucket | Qty on Hand | Unit Cost | Inventory Value | Recommended Action |
|---|---|---|---|---|---|---|---|---|---|
| FG-001 | Rice Cooker Model A | Appliances | 2 Aug 2026 | 16 | 0-30 days | 120 | ₱1,250 | ₱150,000 | Keep normal selling and replenishment |
| PKG-008 | Packaging Roll | Raw Materials | 28 Jul 2026 | 21 | 0-30 days | 200 | ₱55 | ₱11,000 | Use in regular production schedule |
| FD-014 | Frozen Chicken Packs | Food & Beverage | 10 Jul 2026 | 39 | 31-60 days | 80 | ₱180 | ₱14,400 | Push promotion before freshness risk increases |
| COS-022 | Skincare Serum 30ml | Cosmetics | 1 Jun 2026 | 78 | 61-90 days | 45 | ₱320 | ₱14,400 | Review expiry date and prioritize FEFO picking |
| EL-118 | Phone Accessories | Electronics | 9 May 2026 | 101 | 90+ days | 90+ days | ₱210 | ₱12,600 | Run clearance sale or return to supplier |
| APP-030 | Seasonal Jackets | Apparel | 15 Apr 2026 | 125 | 90+ days | 32 | ₱650 | ₱20,800 | Bundle, discount, or review for write-down |
| TOTAL | 537 | ₱223,200 |
| Aging Bucket | Qty on Hand | Inventory Value | % of Total Value | Risk Level |
|---|---|---|---|---|
| 0-30 days | 320 | ₱161,000 | 72.1% | Healthy |
| 31-60 days | 80 | ₱14,400 | 6.5% | Watch |
| 61-90 days | 45 | ₱14,400 | 6.5% | Slow moving |
| 90+ days | 92 | ₱33,400 | 15.0% | High risk |
| TOTAL | 537 | ₱223,200 | 100% |
Download Inventory Aging Report
Stock that has aged past its sellable window does not stay on the books at full cost. Under IAS 2, inventory is measured at the lower of cost and net realisable value. Philippine companies follow the same requirement through PAS 2, the local adoption of IAS 2 under PFRS.
Once the expected selling price falls below cost, the difference becomes a write-down in that period. That is why the 90+ days bucket is an accounting exposure, not only an operations problem.
Spreadsheets can handle easily for a single warehouse. Unfortunately, Across multiple branches and hundreds of batches, received dates get missed and the aging report stops matching physical stock. See how HashMicro automates inventory aging reports with batch level tracking.
5 Key Performance Indicators for Inventory Aging
 Tracking the right KPIs is critical to managing inventory aging effectively. Here are five essential KPIs:
- Inventory turnover ratio: This measures how frequently inventory is sold and replaced, indicating efficient inventory management.
- Percentage of inventory aging: This shows the portion of your stock that has been sitting for too long.
- Carrying costs: These include storage, insurance, and employee expenses, which should be monitored to avoid excessive costs.
- Percentage of slow moving inventory: This metric helps track items that are selling slower than expected.
- Inventory carrying cost as a percentage of revenue: This KPI helps assess whether holding costs align with revenue generation.
Tips for Reducing Aging Inventory
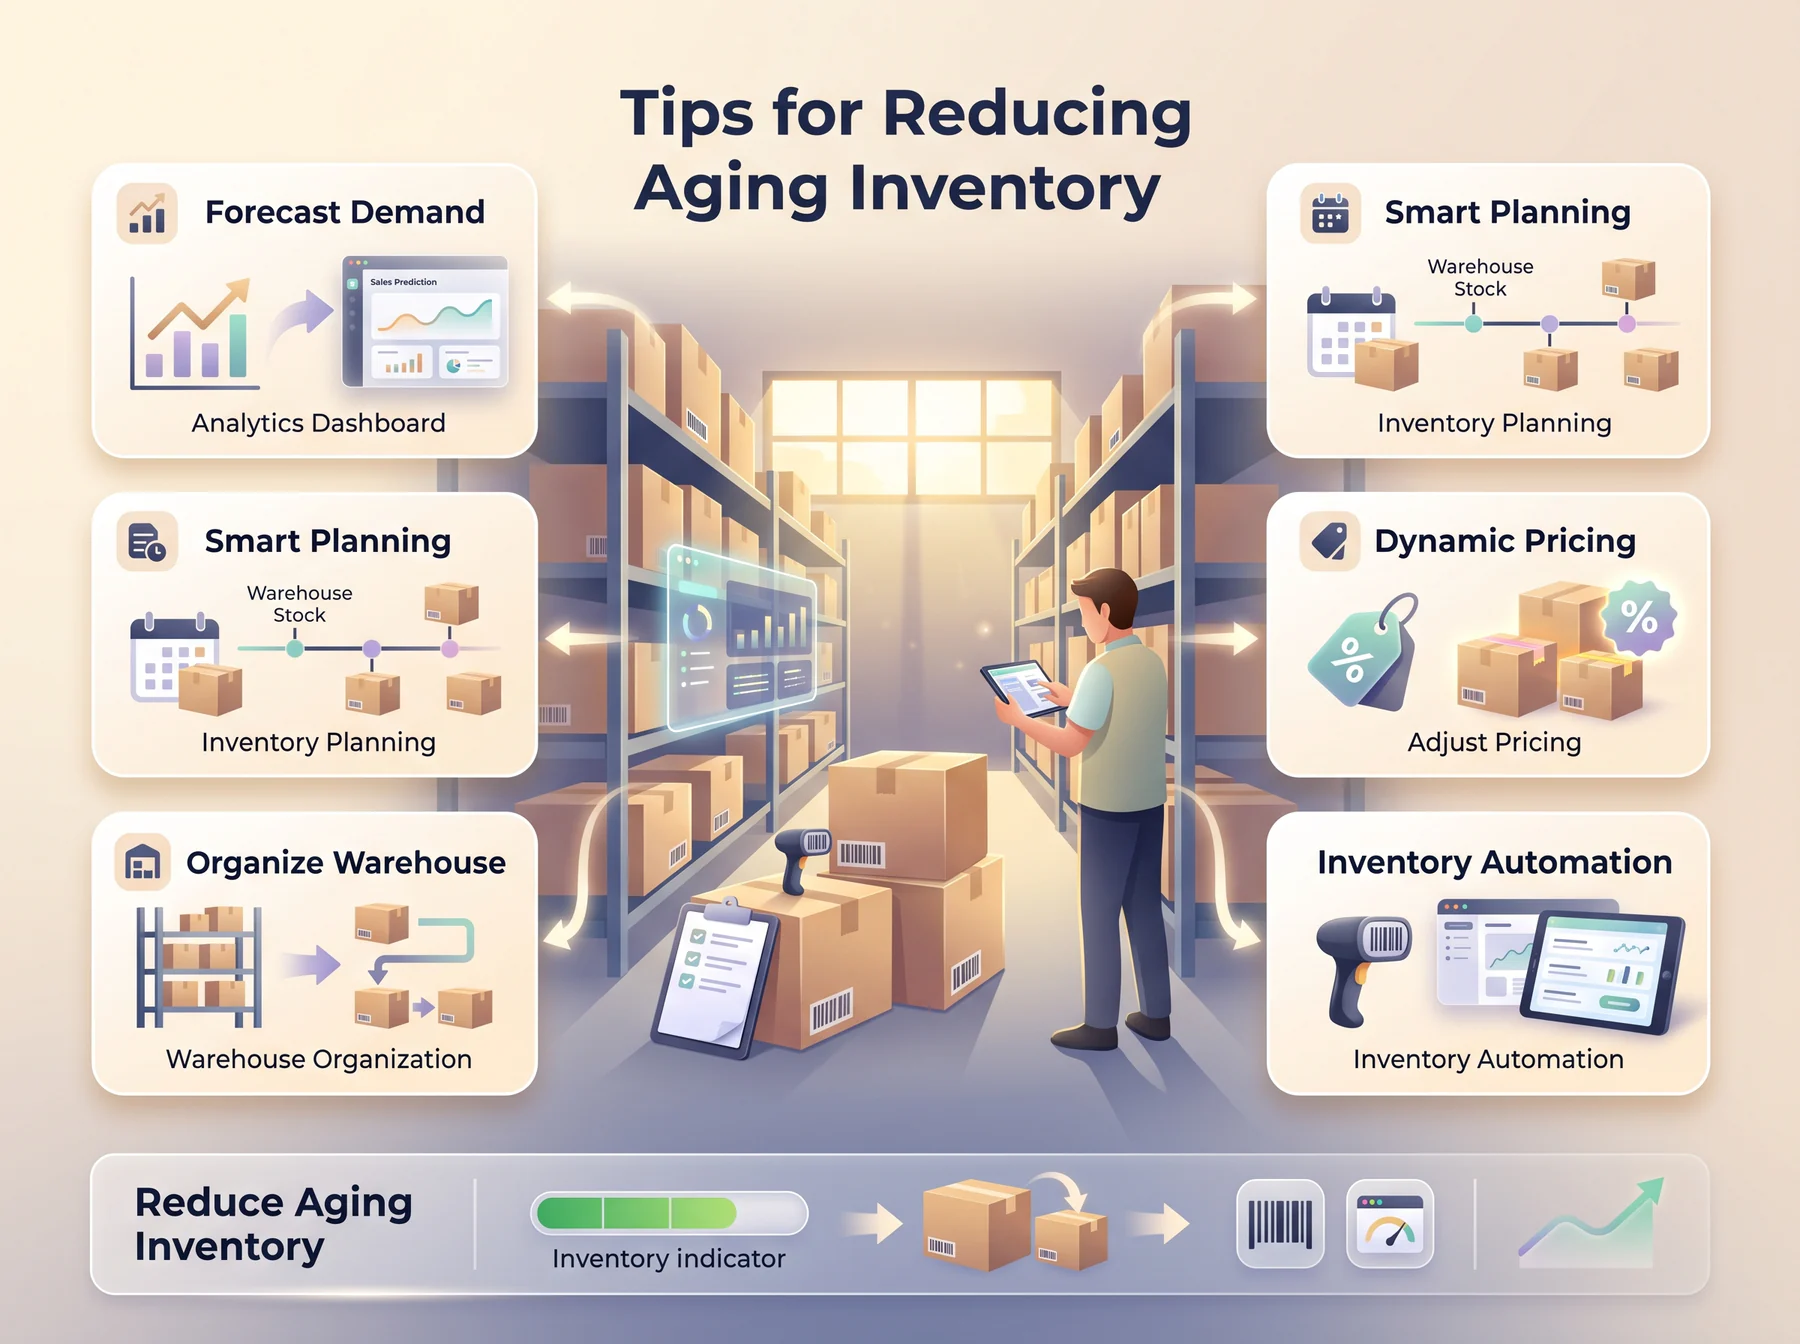
To ensure that your business doesn’t suffer from stockpiled, unsold items, follow these tips for managing aged report:
- Accurate demand forecasting: Use sales data and market trends to predict future demand accurately.
- Strategic inventory planning: Align your inventory strategy with sales goals and market demand to prevent overstocking.
- Adjust pricing strategies: Regularly review and adjust your prices to move older stock faster.
- Enhance warehouse organization: Improve warehouse management to facilitate the movement of older stock.
- Invest in automation: Use inventory management software to optimize stock levels and integrate with a barcode inventory system.
Conclusion
An inventory aging report is a vital tool for managing stock levels, reducing costs, and improving overall business efficiency. By providing insights into slow moving and aging inventory, it allows companies to make informed decisions on stock management, pricing strategies, and demand forecasting.
For businesses looking to apply these insights, reviewing available cloud inventory management software options can help identify the right solution for automating and maintaining these reports at scale.

FAQ About Inventory Aging
To create an aging report, review all unpaid invoices, categorize them by aging periods (e.g., 0-30 days, 31-60 days), and segment customers based on overdue amounts and days outstanding to compile the final report.
The four categories of inventory include raw materials, work in progress (WIP), finished products, and maintenance, repair, and overhaul (MRO) inventory.
In this analysis, inventory items are divided into three groups: Category A consists of 20% of the items that account for 80% of sales. Category B contains 30% of the items contributing 15% to sales. Category C includes the remaining 50% of items, contributing only 5% to sales.
Calculate inventory age in days by subtracting the item’s received date from the report date: Inventory age = Report date − Received date. For accurate results, calculate the age for each SKU or batch separately, especially when the same product arrives in multiple deliveries.
Common inventory aging buckets are 0–30 days, 31–60 days, 61–90 days, and over 90 days. Businesses may adjust these ranges based on product shelf life, demand patterns, and industry requirements. Perishable goods usually need shorter monitoring intervals.