


A financial analysis report examines a company’s financial data to evaluate its performance, liquidity, and long-term viability. It takes figures from statements like the income statement and balance sheet and converts them into structured insights.
Finance managers, CFOs, and business owners use these reports to guide budgeting, investment, and operational decisions. Each report type targets a specific financial dimension, from profitability to solvency.
This guide covers the main types of financial analysis reports, the methods used to produce them, free downloadable templates, and the regulatory context for Australian businesses.
Key Takeaways
A financial analysis report is a structured document that interprets raw financial data to provide insight that decision-makers can act on.
What Is a Financial Analysis Report?

A financial analysis report is a comprehensive document that evaluates a company's financial health, performance, and future prospects. It translates raw accounting data into actionable insights that help investors, executives, and creditors make informed business, lending, and investment decisions.
A financial analysis report is a structured document that evaluates a company’s financial position using data from its core financial statements. It answers key questions about profitability, cash health, and debt exposure.
Analysts compile these reports for internal use, such as budgeting reviews and board presentations, or for external stakeholders like lenders, investors, and auditors using financial analysis tools.
The report does not replace financial statements. Instead, it interprets them. A balance sheet shows what a company owns and owes. A financial analysis report explains what those numbers mean for the business.
For example, a profitability report may show improving gross margins alongside declining net profit. That distinction points to rising operating costs and drives targeted, corrective action.
Financial Analysis Report vs Financial Statement
A financial statement records what happened; a financial analysis report explains what it means. Statements are the raw data; the analysis is the interpretation.
You cannot produce a reliable financial analysis report without accurate, complete financial statements as the foundation. The two documents work together.
Types of Financial Analysis Reports
Choosing the right type depends on the question being asked, the audience being served, and the value of automated financial analysis.
1. Profitability analysis report
A profitability analysis report measures how efficiently a business generates earnings relative to its revenue, assets, or equity. It covers metrics like gross profit margin, net profit margin, and return on equity.
This report is commonly used during quarterly reviews or before seeking investment. It answers whether the business is making money from its core operations, not just from one-off events.
2. Liquidity analysis report
A liquidity analysis report assesses whether a business has sufficient short-term assets to meet its short-term obligations. It focuses on current assets versus current liabilities.
Key indicators include the current ratio, quick ratio, and cash ratio. A low liquidity reading signals potential difficulty meeting payroll, supplier invoices, or tax obligations on time.
3. Solvency and leverage analysis report
A solvency analysis report evaluates a company’s ability to meet long-term debt obligations. It examines the debt-to-equity ratio, interest coverage ratio, and total debt ratio.
Lenders and investors rely on solvency reports before extending credit or capital. A business may be profitable and still carry unsustainable debt levels, making this report critical for risk assessment.
4. Efficiency (activity) analysis report
An efficiency analysis report measures how effectively a company uses its assets to generate revenue. It tracks metrics like inventory turnover, accounts receivable turnover, and asset turnover.
A low accounts receivable turnover suggests customers are slow to pay. This affects cash flow and requires an operational response, such as tightening credit terms or accelerating collections.
5. Cash flow analysis report
A cash flow analysis report examines the movement of cash in and out of a business across operating, investing, and financing activities. It is distinct from profitability reports.
A company can report strong profits and still face a cash crisis. This report identifies shortfalls before they become critical, making it essential for short-term operational planning.
6. Horizontal analysis report (trend analysis)
A horizontal analysis report compares financial data across multiple periods to identify trends over time. It expresses changes as both absolute values and percentages for clear comparison.
Comparing three years of revenue figures shows whether growth is accelerating, stable, or declining. This helps management set realistic targets and identify problem areas before they escalate.
7. Vertical analysis report (common-size)
A vertical analysis report expresses each line item on a financial statement as a percentage of a base figure. On an income statement, each item is shown as a percentage of total revenue.
This method allows straightforward comparison across companies of different sizes or across reporting periods. It reveals structural shifts, such as cost of goods sold rising as a share of revenue.
8. Break-even analysis report
A break-even analysis report calculates the point at which total revenue equals total costs, producing neither profit nor loss. It is commonly used when launching new products or entering new markets.
For Australian businesses planning capital investment or new store openings, this report determines the minimum sales volume required to justify the expenditure before committing resources.
For quick reference, the table below summarises which report answers which financial question.
Report Type |
Primary Question Answered |
Best Used By |
Key Metrics |
| Profitability analysis | Is the business generating sufficient earnings from operations? | CFOs, investors, management during quarterly reviews | Gross profit margin, net profit margin, return on equity |
| Liquidity analysis | Can the business meet its short-term obligations? | Finance managers, creditors, accounts payable teams | Current ratio, quick ratio, cash ratio |
| Solvency and leverage analysis | Can the business sustain its long-term debt obligations? | Lenders, investors, board members | Debt-to-equity ratio, interest coverage ratio, total debt ratio |
| Efficiency (activity) analysis | How effectively is the business using its assets to generate revenue? | Operations managers, finance teams | Inventory turnover, accounts receivable turnover, asset turnover |
| Cash flow analysis | Is the business generating and managing cash effectively? | CFOs, operations managers, short-term planners | Operating, investing, and financing cash flows |
| Horizontal analysis (trend) | How has financial performance changed over time? | Management and analysts tracking growth trends | Period-over-period changes in revenue, expenses, and profit |
| Vertical analysis (common-size) | How does each line item compare as a share of the total? | Analysts comparing businesses of different sizes | Each line item as a percentage of total revenue |
| Break-even analysis | What sales volume is needed to cover all costs? | Business owners, product managers, expansion planners | Fixed costs, variable costs, break-even point |
Financial reports become more useful when decision-makers can turn complex figures into clear actions without spending hours compiling spreadsheets. Click the Hashy banner to explore how an AI coworker can compare reporting periods, identify trends, highlight financial risks, and convert business data into decision-ready insights.


Key Financial Analysis Methods
Financial analysis methods are the analytical techniques applied to financial data to produce meaningful reports. Each method suits different analytical goals and report types, and many are used in combination within a platform for analysing financial condition.
1. Ratio analysis
Ratio analysis is the most widely used financial analysis method. It divides one financial figure by another to produce a ratio that reveals a specific aspect of financial performance.
Profitability ratios include gross profit margin, net profit margin, and return on equity. These measure how much the business earns from its revenue and invested capital.
Liquidity ratios include the current ratio and quick ratio. These determine whether short-term assets are sufficient to cover short-term liabilities without liquidating long-term holdings.
Solvency ratios include the debt-to-equity ratio and interest coverage ratio. These assess long-term financial risk and the company’s capacity to service debt obligations over time.
Efficiency ratios include inventory turnover, accounts receivable turnover, and asset turnover. These reveal how productively a business converts its resources into revenue generation.
2. Horizontal (trend) analysis
Horizontal analysis compares financial line items across two or more reporting periods. It shows the direction and magnitude of change, expressed as both a dollar amount and a percentage.
This method is useful for identifying revenue growth rates, cost trends, and shifts in operating expenses over time. It provides context that single-period statements cannot offer on their own.
3. Vertical (common-size) analysis
Vertical analysis converts each line item on a financial statement into a percentage of a reference figure. For income statements, revenue is the base. For balance sheets, total assets is the base.
This approach standardises data, making it easier to compare companies of different sizes or to track structural changes within the same business across multiple reporting periods.
4. Variance analysis
Variance analysis compares actual financial results against a budget report, forecast, or prior period. The difference, or variance, indicates where performance has deviated from expectations.
Favourable variances occur when actual results exceed the target, such as higher-than-expected revenue. Unfavourable variances, such as cost overruns, require investigation and corrective action.
5. Scenario and sensitivity analysis
Scenario analysis tests financial outcomes under different assumed conditions, such as a revenue decline or an interest rate increase. It helps businesses prepare for a range of possible futures.
Sensitivity analysis isolates one variable at a time to measure its impact on a key metric. It identifies which assumptions carry the most financial risk so management can prioritise accordingly.
What to Include in a Financial Analysis Report
A well-structured financial analysis report covers more than just numbers. It gives context, explains findings, and guides the reader towards informed decisions through financial performance reports.
1. Executive summary and key findings
The executive summary provides a concise overview of the report’s most important findings. It is written last but placed first, giving readers a clear picture before they engage with the detail.
It should highlight the top two or three financial conclusions, whether positive or concerning. Board members and senior leaders often rely on this section alone for decision-making.
Keep it factual and direct. Avoid over-qualifying statements or burying the key message in caveats that reduce clarity and impact.
2. Overview of financial statements analysed
This section identifies which financial statements were used as source data, the reporting periods they cover, and which accounting standard applies, such as AASB or IFRS.
It should note whether the statements have been audited or reviewed. This establishes the credibility and scope of the analysis before the reader interprets any results.
Including this overview ensures readers understand the limitations of the report alongside its findings, which is especially important for external stakeholders.
3. Key ratios, metrics, and trend data
This section presents the calculated ratios and metrics that form the core of the analysis. Data is typically displayed in tables, with prior-period figures included for direct comparison.
Each ratio should be accompanied by a brief explanation of what it measures and whether the result is favourable or unfavourable relative to benchmarks or prior periods.
Trend charts are useful additions here, particularly for reports presented to non-financial stakeholders who prefer visual summaries over tables of raw numbers.
4. Period comparisons and benchmark context (AU industry data)
Comparing results against prior periods reveals internal trends, while benchmarking against industry data shows how the business performs relative to its peers.
Australian businesses can access benchmarks through the Australian Bureau of Statistics (ABS), the ATO small business benchmarks, and sector-specific trade associations.
A net profit margin of 8% tells you little without knowing whether the industry average is 5% or 15%. Benchmark context is what makes results meaningful.
5. Insights, risks, and actionable recommendations
This section moves beyond data to deliver the “so what” of the report. It translates findings into specific insights about business performance, financial risks, and areas requiring attention.
Recommendations should be practical and prioritised. Where a risk is material, the report should propose a specific course of action rather than a vague suggestion to monitor the situation.
This is the section that separates a high-quality financial analysis report from a data summary. Decision-makers need guidance, not just numbers presented in a different format.
6. Company overview
The company overview section provides the business context that makes financial ratios meaningful. It describes the industry, the company’s core operations, and any significant competitive factors that affect performance.
Its role is to orient the reader, not to replicate an annual report. Include the reporting period, the business model, and any material events during the period, such as a major acquisition, restructure, or market shift.
For Australian businesses, this is the appropriate place to note relevant regulatory context. This includes whether the entity is classified as a large proprietary company under the Corporations Act 2001, or whether AASB standards apply.
3 Core Financial Statements in a Complete Analysis
A complete financial analysis report is only as reliable as the documents it draws from. Three foundational statements form the basis of every analysis type covered in this guide.
Each statement captures a different dimension of the business. Together, they give analysts the full picture needed to assess profitability, liquidity, solvency, and operational efficiency.
Australian businesses reporting under AASB standards are required to prepare all three. For smaller entities using management accounts, the same three documents provide the minimum data set for any meaningful financial analysis.
1. Income statement
The income statement records revenue, expenses, and net profit or loss over a defined accounting period. It is the primary source for profitability analysis.
Analysts use it to calculate gross profit margin, net profit margin, and EBITDA. It shows whether the business is generating earnings from its core operations and where cost pressures are emerging.
2. Balance sheet
The balance sheet provides a snapshot of the company’s financial position at a single point in time. It lists assets, liabilities, and shareholder equity.
Liquidity and solvency ratios are both derived from the balance sheet. It reveals whether the business can meet short-term obligations and how it is financed relative to what it owns.
3. Cash flow statement
The cash flow statement tracks the movement of cash in and out of the business across operating, investing, and financing activities. Under AASB 107, it is a required component of general purpose financial statements.
A business can show strong profits on its income statement while facing a genuine cash crisis. The cash flow statement is the document that exposes that gap before it becomes a financial emergency.
Where the report is prepared for investors or lenders, the analysis should be improved by including a valuation reference. This may assess the business using asset-based, earnings-based, or market comparable methods.
Downloadable Financial Analysis Report Templates
The templates below are free to download and formatted for Australian businesses. Each covers a specific type of financial analysis and can be used as a financial analyst report example or sample of financial analysis report.
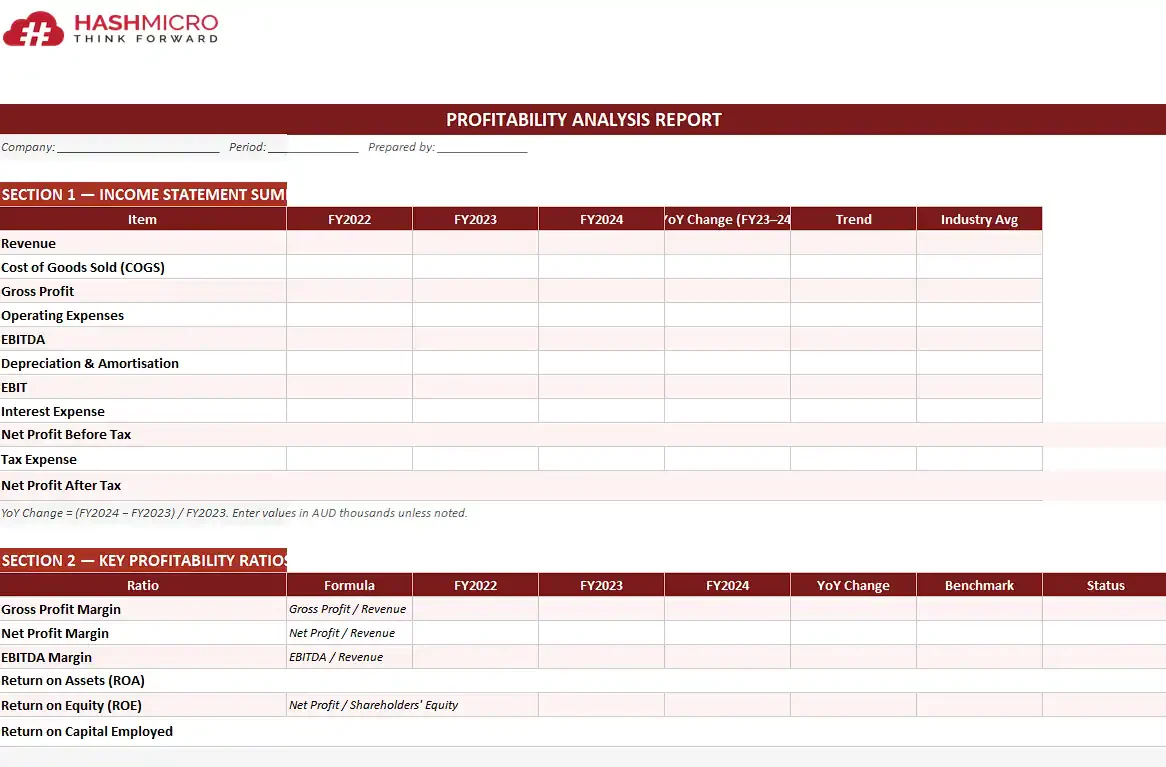
1. Profitability analysis report template
This template includes pre-built sections for gross profit margin, net profit margin, return on assets, and return on equity. Enter your income statement figures and ratios calculate automatically.
Profitability Analysis Report Template
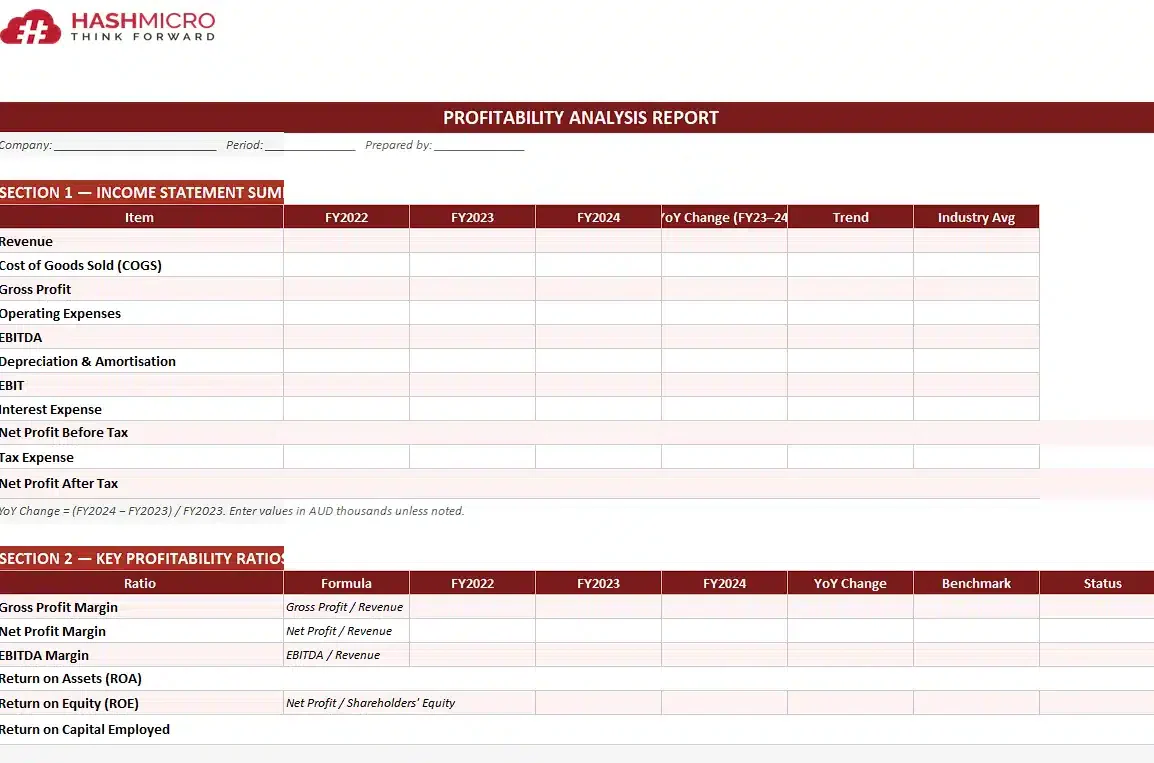
It includes a period-on-period comparison table and a summary findings section for management reporting. Suitable for monthly, quarterly, or annual use. This format also works as a practical financial analyst report example for profitability review.
2. Liquidity analysis report template
This template covers the current ratio, quick ratio, and cash ratio, with fields to record current assets and liabilities across multiple periods.
Liquidity Analysis Report Template
It includes a traffic light indicator for each ratio to flag whether results fall within healthy, caution, or critical ranges based on general financial benchmarks. It can also be used as a simple sample of financial analysis report for liquidity review.
3. Cash flow analysis report template
This template structures cash flow data across operating, investing, and financing activities, aligned with the format required under AASB 107.
Horinzontal Trend Analysis Report Template
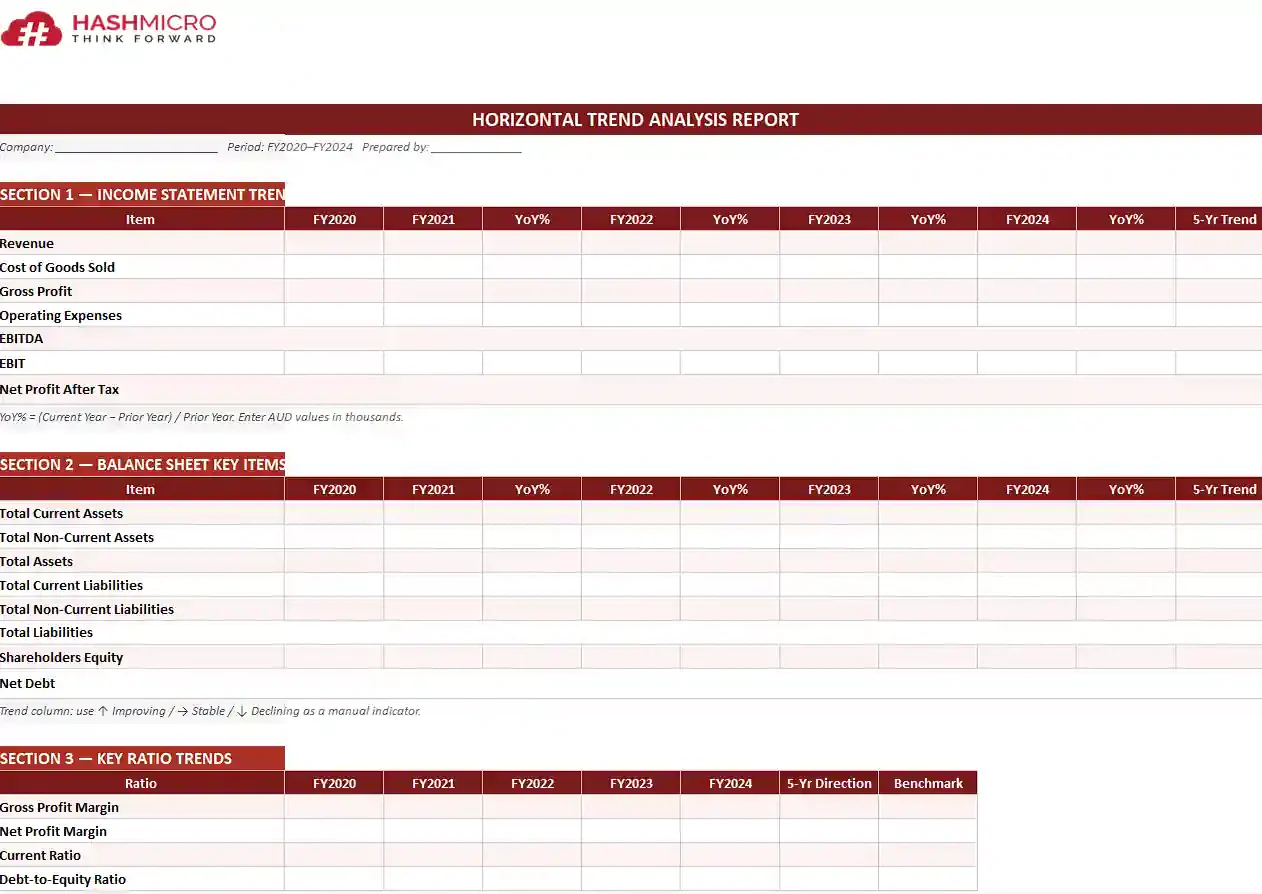
Trend charts update as you enter data. Use it to present year-on-year performance to boards, investors, or lenders in a clear visual format.
5. Vertical (common-size) analysis report template
This template converts your income statement and balance sheet into percentage-based common-size formats for single or multi-period views.
Vertical Trend Analysis Report Template
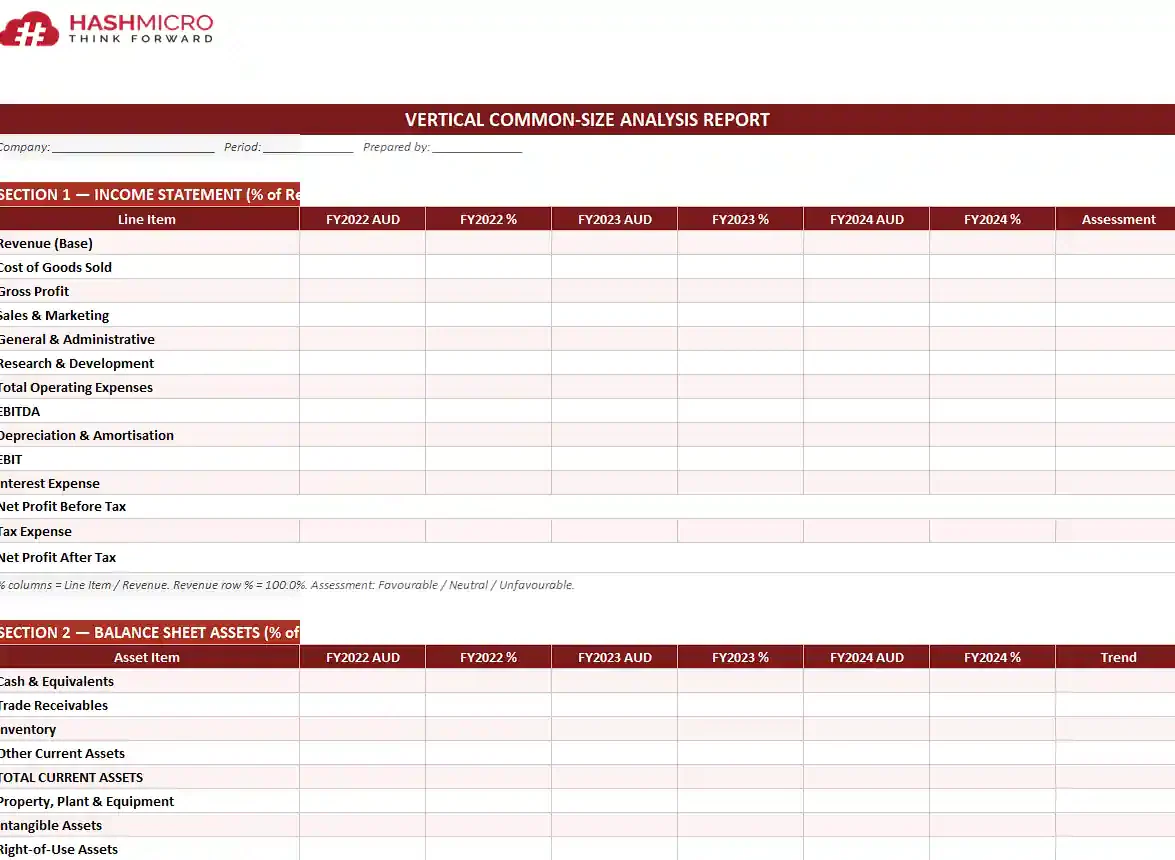
It includes a benchmark column where you can enter industry averages for direct comparison against your own cost and revenue proportions.
6. Break-even analysis report template
This template calculates your break-even point in both units and revenue, based on fixed costs, variable costs per unit, and selling price. It includes a contribution margin calculation and a dynamic break-even chart.
Break-Even Analysis Report Template
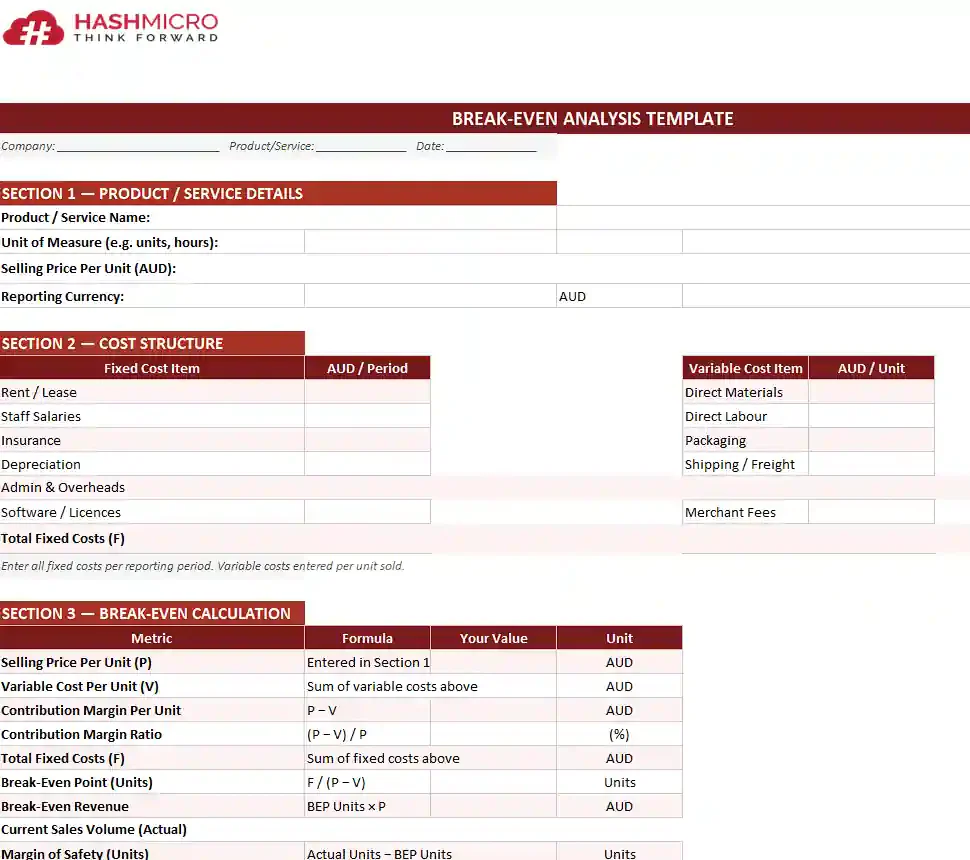
Useful for product launches, pricing reviews, and evaluating major capital investments before committing resources.
7. EOFY financial analysis report template (AU)
This template is structured around the Australian financial year ending 30 June. It consolidates profitability, liquidity, solvency, and efficiency analysis into a single year-end report.
EOFY Financial Analysis Report Template
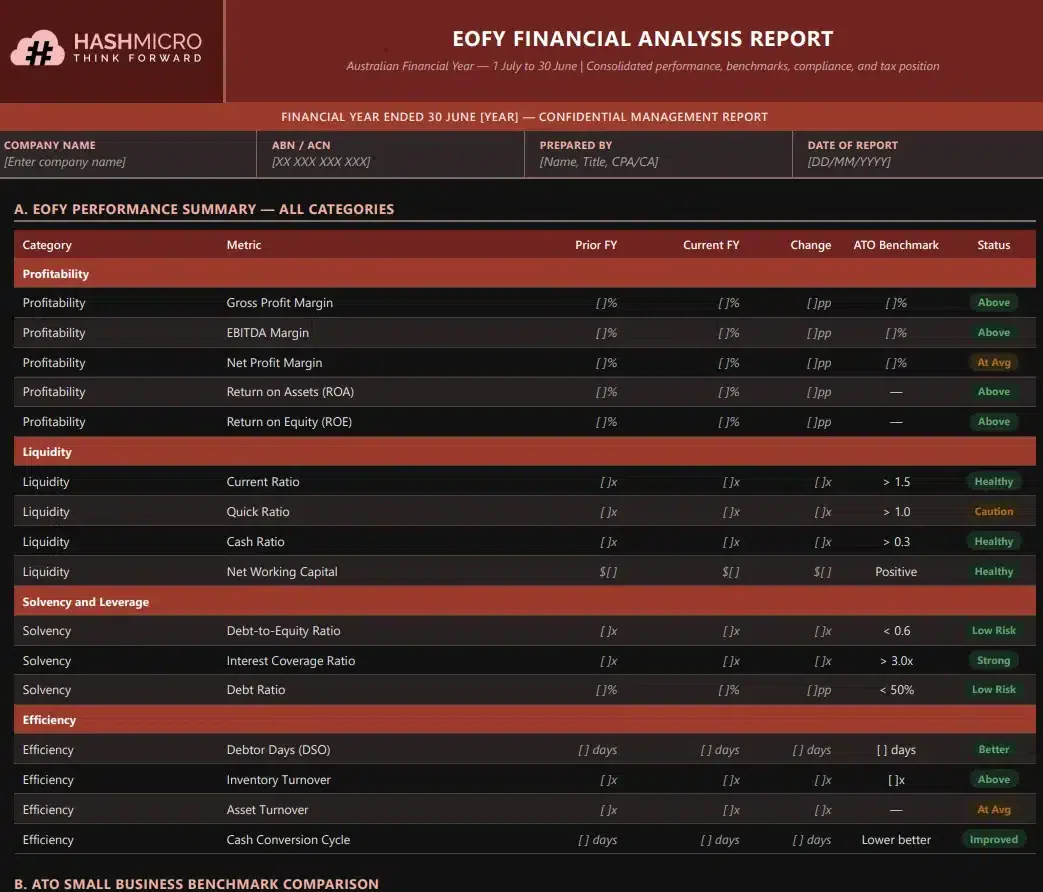
It includes sections for EOFY tax considerations, ATO benchmark comparisons, and a management commentary block for narrative context alongside the numbers.
8. Executive financial analysis dashboard template
This template presents key financial ratios and metrics on a single-page dashboard designed for board presentations and investor briefings.
Executive Financial Analysis Report Template
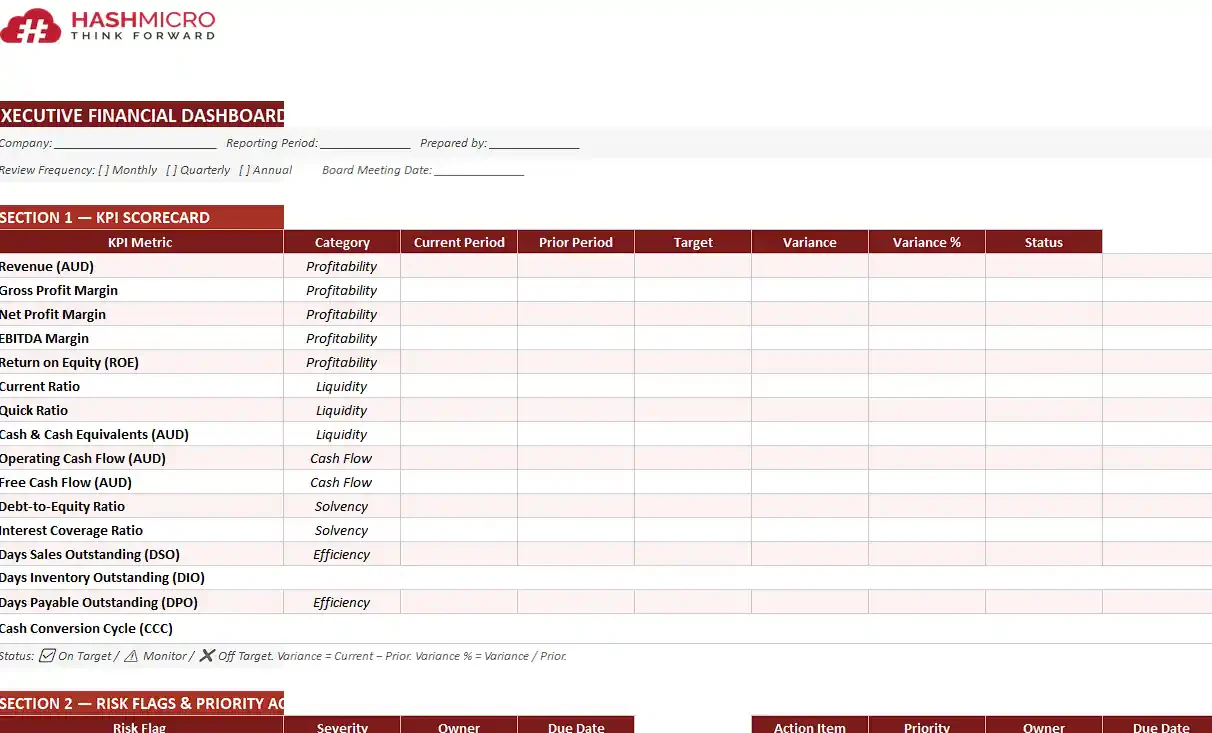
It includes visual indicators, trend summaries, and a KPI table, giving senior stakeholders a clear, at-a-glance view of financial performance without navigating lengthy reports. Use this dashboard as a practical financial analyst report example or sample of financial analysis report for board updates, investor briefings, or EOFY reviews.
For businesses that need more than a spreadsheet, HashMicro accounting software helps automate financial reports, track profitability, and manage accounting data in one integrated system.

How to Write a Financial Analysis Report
Writing an effective financial analysis report follows a clear sequence. The quality of each section depends on the rigour applied at every preceding point when preparing detailed financial reports.
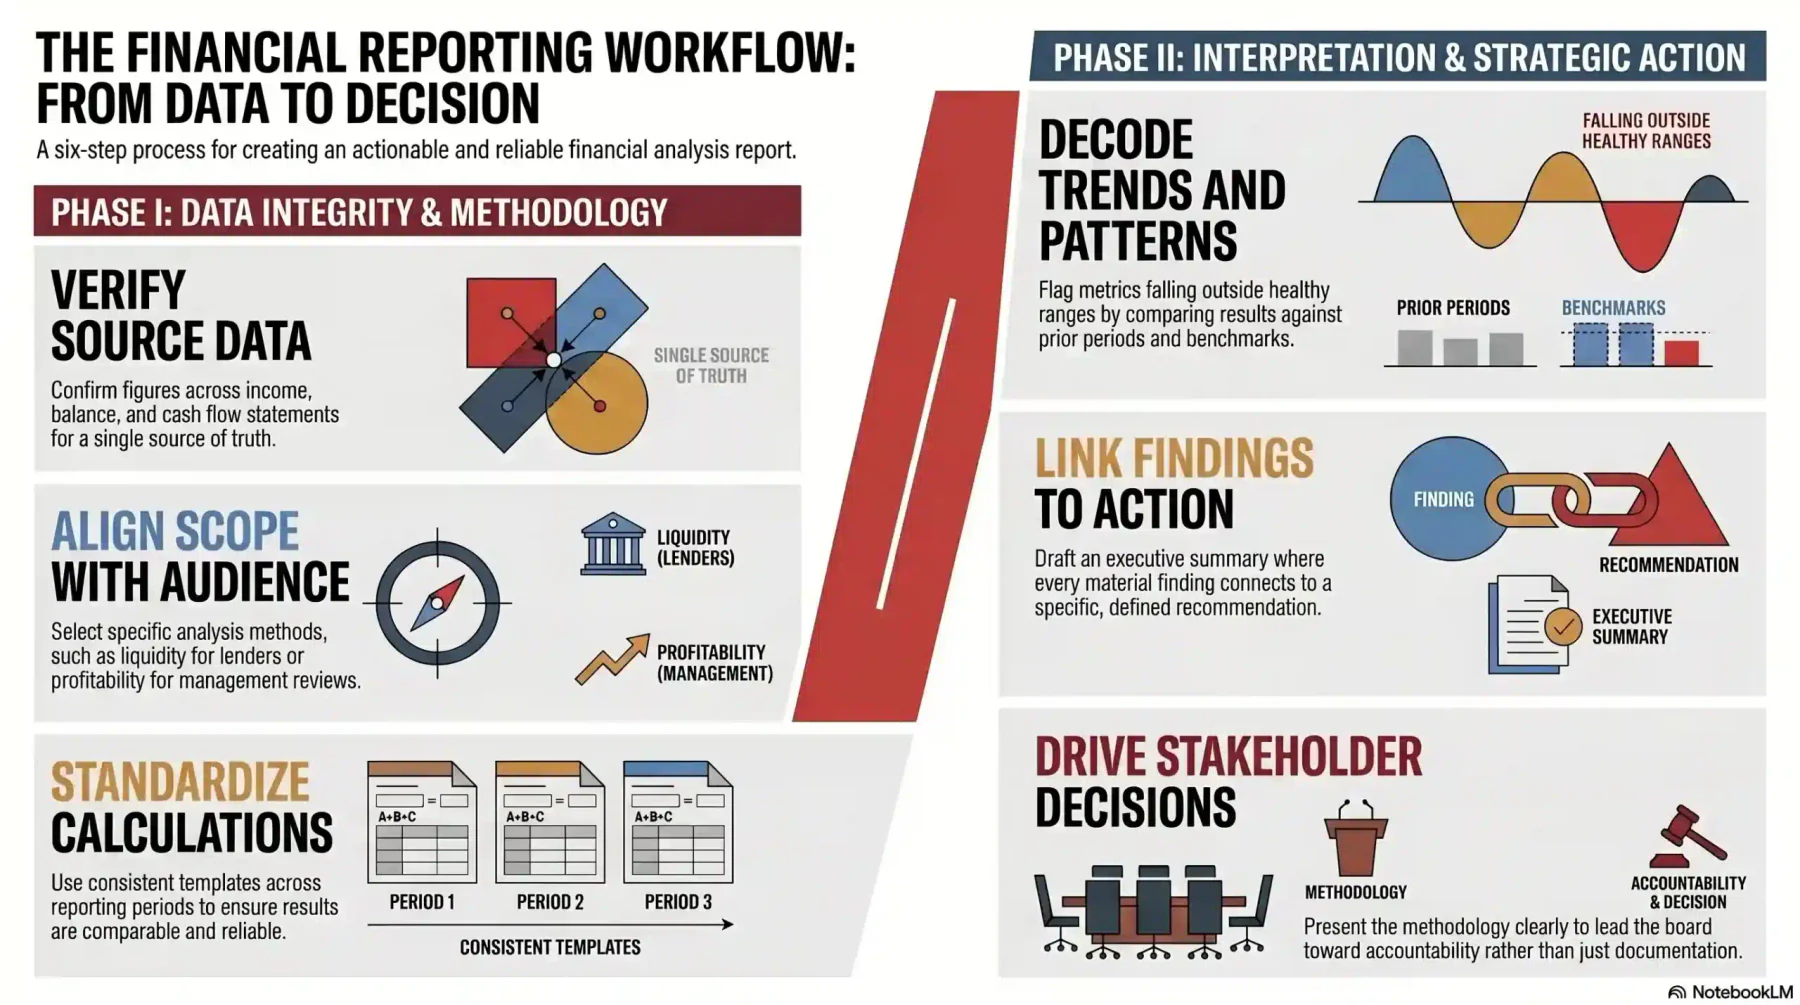
1. Gather and verify your financial statements
Collect your income statement, balance sheet, and cash flow statement for all periods under review. Confirm that figures are complete, reconciled, and drawn from a single source of truth.
Do not proceed with analysis if the underlying statements contain errors or unreconciled balances. A financial analysis report is only as reliable as the data it is built on.
For entities reporting under AASB standards, ensure statements have been prepared by a qualified accountant and reviewed or audited where required.2. Choose your analysis types and methods
Decide which types of analysis are relevant to the report’s purpose. A lender requires solvency and liquidity analysis; a management review may prioritise profitability and efficiency.
Selecting the right methods upfront prevents scope creep and keeps the report focused on the questions that matter most to your intended audience.
Document your choices so stakeholders understand why certain analyses are included and others are not. Transparency about scope builds credibility.
3. Calculate key ratios and metrics
Apply your chosen methods to the verified financial data. Calculate each ratio systematically, checking inputs against source statements to avoid transcription errors.
Record both current-period and prior-period results for every metric to enable meaningful comparison and support trend identification.
Use a structured template or spreadsheet to maintain consistency across reporting periods. Inconsistent calculation methods undermine comparability and reduce the report’s value.
4. Identify trends, patterns, and warning signs
Review your calculated metrics across periods and against industry benchmarks. Look for directional shifts, unusual spikes, or sustained deterioration in any key indicator.
Flag metrics that fall outside healthy ranges. Note whether any movement is short-term or part of a longer pattern, as this determines the level of risk it represents.
This is where finance expertise adds the most value. Numbers do not explain themselves; your interpretation of what the trends mean is what makes the report genuinely useful.
5. Write the executive summary and recommendations
Draft the executive summary last, once the full analysis is complete. Summarise the three to five most significant findings in clear, direct language aimed at a non-technical audience.
Each material finding should link to a specific recommendation. Avoid vague guidance; propose a defined action such as renegotiating supplier payment terms or reducing short-term debt exposure.
Assume the reader understands business but may not be familiar with accounting ratios. Plain language and clear structure increase the likelihood that findings will lead to action.
6. Present findings to stakeholders and follow up
Prepare a presentation version of the report for board or management review. Lead with the executive summary and be ready to explain the methodology behind any ratio or finding.
Invite questions and document decisions or actions agreed in response to the report. These commitments should be tracked and revisited in the next reporting cycle.
A financial analysis report has limited value if it sits unread. Its purpose is to drive informed decisions and accountability, not simply to document financial performance.
For teams handling frequent reports, HashMicro’s accounting software helps automate financial reporting, track performance, and reduce manual errors.
Australian Regulatory Context for Financial Analysis
Australian businesses operate within a regulatory framework that shapes how financial data must be reported and analysed. Understanding these requirements is essential for producing compliant, credible reports.
1. AASB standards: what Australian businesses must report and analyse
The Australian Accounting Standards Board (AASB) sets the accounting standards governing financial reporting in Australia, aligned with International Financial Reporting Standards (IFRS). Key standards include AASB 101 (Presentation of Financial Statements), AASB 107 (Statement of Cash Flows), and AASB 108 (Accounting Policies).
Publicly accountable entities and large proprietary companies must prepare AASB-compliant statements. Financial analysis of those statements should use the same definitions and categorisations to ensure consistency.
2. ASIC reporting obligations for proprietary and public companies
The Australian Securities and Investments Commission (ASIC) sets financial reporting obligations under the Corporations Act 2001. Large proprietary companies must lodge audited financial statements annually, meeting two of three criteria: revenue above $50 million, gross assets above $25 million, or more than 100 employees.
Public companies and registered managed investment schemes face stricter requirements covering disclosure, presentation, and lodgement timeframes. ASIC’s guidance documents outline these obligations in full.
3. ATO and tax considerations in annual financial analysis
The Australian Taxation Office (ATO) publishes small business benchmarks across a wide range of industries, based on aggregated tax return data. These provide a useful reference point for ratio analysis and peer comparison.
Annual financial analysis should account for the impact of tax obligations on cash flow, particularly deferred tax items. The EOFY on 30 June creates a natural anchor point, simplifying comparison between management accounts and ATO-reported figures.
"A financial analysis report turns compliance documents into management decisions. For Australian businesses, that means linking AASB-compliant statements to ATO benchmarks, and acting on the gap before EOFY closes."
Best Practices for Financial Analysis Reporting in Australia
Following established best practices ensures your financial analysis reports are consistent, credible, and genuinely useful to the people who rely on them.
1. Time your annual financial analysis to the EOFY (30 June)
The Australian financial year runs from 1 July to 30 June. Timing your annual analysis to this cycle aligns with statutory reporting, tax obligations, and the release of ATO benchmark data.
Completing the analysis shortly after 30 June, once accounts are finalised, allows management to act on findings while conditions are still responsive to intervention.
2. Benchmark your ratios against AU industry averages (ABS data)
The Australian Bureau of Statistics (ABS) publishes detailed industry statistics that contextualise financial ratios, and the ATO’s industry benchmarks provide a complementary tax-return-based dataset. Benchmarking transforms an internal result into a competitive indicator.
Review benchmark sources annually, as industry averages shift with economic conditions. Using outdated benchmarks can produce incorrect conclusions about relative performance.
3. Use accounting software to automate data collection
Cloud accounting platforms integrate with reporting tools that automate ratio calculation and financial statement generation. Automation reduces manual errors and frees finance teams to focus on interpretation rather than data entry.
For Australian mid-market businesses with multiple entities or business units, HashMicro’s accounting module consolidates ledger data across operations in real time, letting finance teams produce ratio analysis and EOFY reports without manual export.
Conclusion
A financial analysis report is one of the most valuable tools available to any Australian business. It turns financial statements into clear, actionable insight that supports better decisions across the entire business.
Whether you are reviewing profitability, managing liquidity, planning for growth, or preparing for an investor conversation, the right type of report gives you the evidence to act with confidence.
Use the free templates above to get started and get a free consultation with our experts today so we can help apply them to your business.

Frequently Asked Question
There is no law requiring Australian businesses to produce a financial analysis report as a standalone document. However, certain obligations under the Corporations Act 2001 require disclosing entities and large proprietary companies to prepare financial reports audited under Australian Auditing Standards. For smaller businesses, financial analysis is strongly recommended by the ATO.
Most Australian accountants recommend at minimum a quarterly review for trading businesses, with a full annual report aligned to the financial year ending 30 June. Businesses carrying significant debt, operating in seasonal industries, or seeking external funding are typically advised to produce monthly reporting.
Yes, Australian lenders, including the major banks and most non-bank lenders, require financial analysis documentation. Typically, lenders will request the last two to three years of financial statements alongside key ratio analysis covering liquidity, solvency, and cash flow.
It is not legally required, but the ATO strongly encourages keeping accurate records of all income and expenses. A basic profitability and cash flow analysis helps with BAS lodgement, identifying tax deductions, and planning for slow periods. The ATO's Small Business Benchmarks tool provides free industry comparison data that sole traders can use as a simple starting point.
A financial statement is a structured record of financial data, such as an income statement, balance sheet, or cash flow statement, for a specific period. A financial analysis report interprets that data, applying ratios, benchmarks, and commentary to explain what the numbers mean. Financial statements present the facts; financial analysis reports explain what those facts indicate and what action the business should take.
A common example is a profitability analysis report prepared at the end of the financial year. It would include gross profit margin, net profit margin, and return on equity for the year, benchmarked against ATO Small Business Benchmarks. The report identifies whether margins improved or declined year on year and recommends actions such as renegotiating supplier contracts or reviewing pricing.