


Businesses generate massive amounts of data every second. Customer interactions, supply chains, financial records, and employee performance all produce valuable information. However, raw data has little value unless businesses turn it into clear and useful insights.
Modern analytics helps companies turn data into actionable decisions. With business intelligence (BI) reporting, businesses can improve operations, cut costs, and spot trends earlier. This enables a shift from reactive to proactive planning.
Key Takeaways
Modern BI connects data from multiple systems into clear dashboards for smarter decisions.
Ensures reliable insights by centralising data, maintaining accuracy, and enabling self-service analytics for better decision making.
From daily operations to forecasting trends, BI helps companies act confidently.
Define objectives, audit data, select the right platform, and train staff to fully leverage BI capabilities.

What Is Business Intelligence Reporting?
Business intelligence reporting is the process of collecting, analysing, and presenting business data to support better decisions. It turns raw information from different systems into clear insights that managers and software for business stakeholders can understand and act on.
Unlike traditional reports that rely on manual spreadsheets, modern BI tools automate data collection and analysis. They connect directly to live databases and present results through dashboards, charts, and interactive reports.
This approach creates a continuous data cycle. Daily operations generate data, BI tools analyse it, and teams use the insights to improve strategies and performance. It also encourages a data-driven culture where different departments can access the reports they need.
Why Business Intelligence Reporting Matters
Market conditions change quickly due to customer behaviour, economic factors, and competition. Businesses need reliable data to support decisions instead of relying on guesswork or outdated information.
1. Data-driven decision making
Business intelligence reporting helps replace guesswork with structured data. Leaders can review performance, track campaign results, and evaluate operations using clear and measurable insights.
This makes it easier to respond to changes and adjust strategies based on actual data, not just experience.
2. Improved operational visibility
As businesses grow, operations become more complex and harder to monitor across teams and systems. BI reporting combines data from different sources to provide a clearer view of daily activities.
With better visibility, businesses can identify inefficiencies, delays, and performance gaps earlier. Managers can track key metrics and make adjustments where needed.
3. Better strategic planning
Planning for growth requires a clear understanding of past performance and current conditions. BI reporting helps businesses analyse trends and identify potential opportunities.
With this insight, leaders can set realistic goals, track progress, and adjust plans when results do not meet expectations.
Key Components of Business Intelligence Reporting
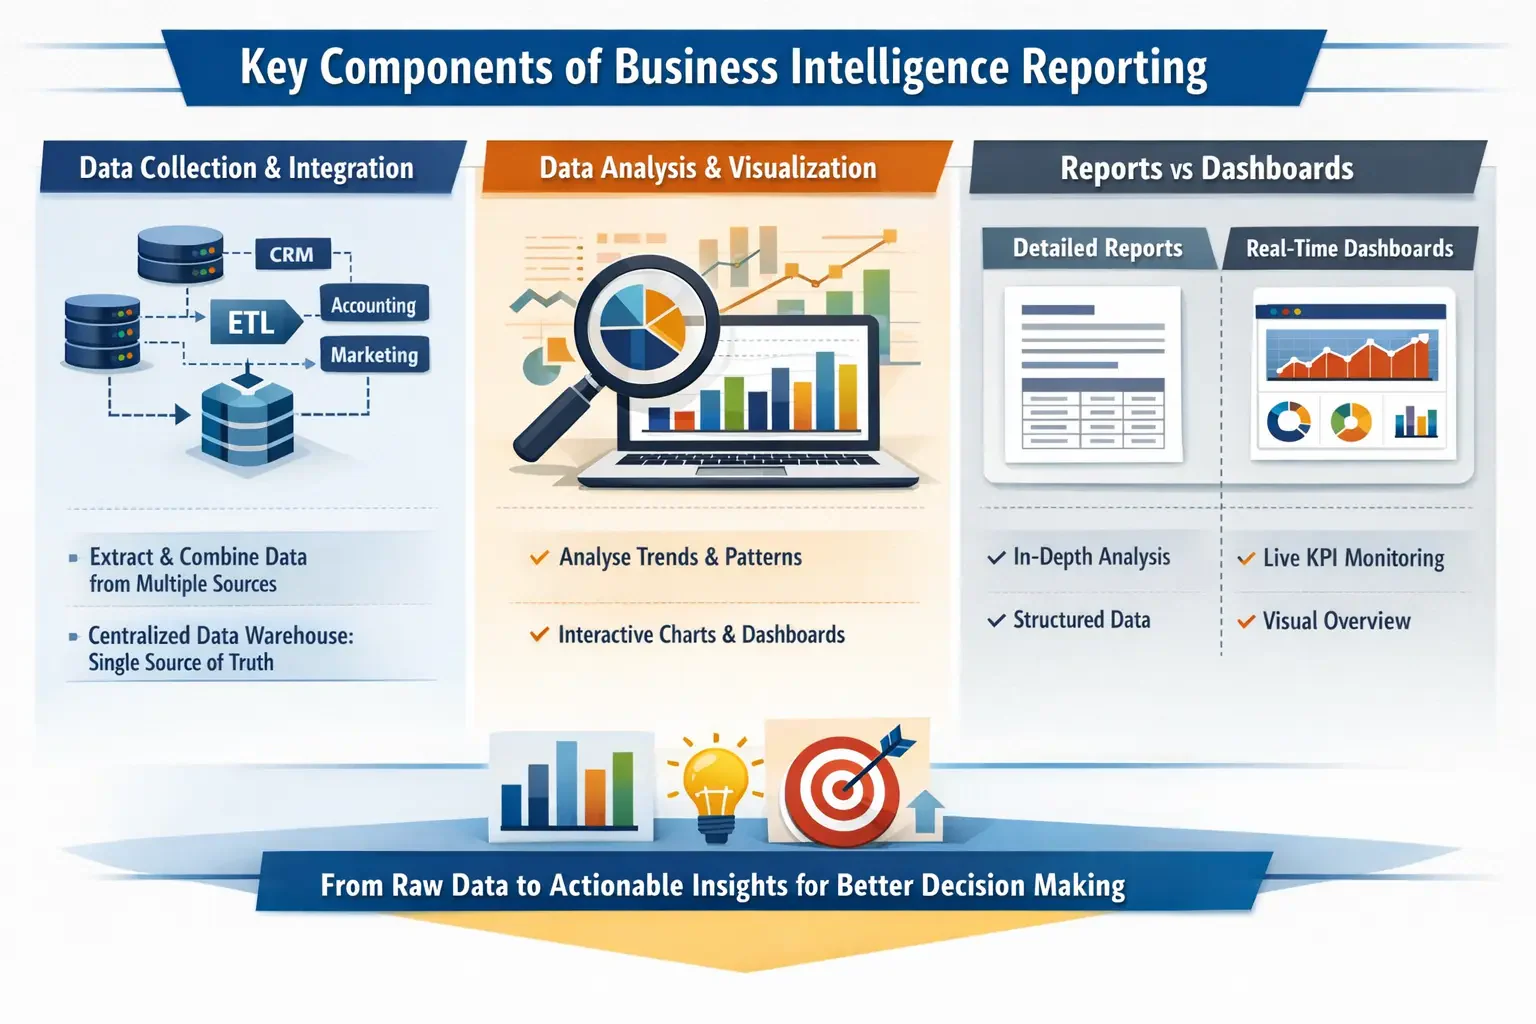
Business intelligence reporting uses several connected components to turn raw data into useful insights. These components collect, process, and present data in a way that supports better decision-making.
1. Data collection and integration
Businesses often store data across systems such as CRM, accounting software, and marketing platforms. Integration processes bring this data together into a single source.
The data is then cleaned and standardised before being stored in a central repository. This improves consistency and reduces errors in reporting.
2. Data analysis and visualisation
Once data is centralised, analytical tools process it to identify patterns and trends. This helps businesses understand performance across different areas.
The results are presented through dashboards, charts, and reports. Clear visuals make it easier for teams to interpret data and take action.
3. Reports vs dashboards
Reports and dashboards serve different purposes but work together in BI reporting. Reports provide detailed analysis over a specific period, often with structured data.
Dashboards show key metrics in real time, allowing managers to monitor performance quickly and access detailed reports when needed.
Common Types of BI Reports
Business intelligence reporting includes several report types designed for different roles. Each type supports a specific use case, from daily monitoring to long-term analysis.
1. Operational reports
Operational reports focus on daily business activities and help teams monitor performance in real time. Managers use them to track routine processes and respond to issues quickly.
These reports typically include metrics such as sales, inventory levels, and operational status.
2. Analytical reports
Analytical reports focus on identifying trends and understanding past performance. They use historical data to highlight patterns and evaluate outcomes.
These insights help businesses refine strategies and make more informed decisions over time.
3. Executive dashboards
Executive dashboards provide a high-level view of business performance for leadership teams. They combine key metrics from different areas into a single view.
This helps leaders quickly assess performance and identify areas that need attention.
Business Intelligence Reporting Challenges

While business intelligence reporting offers strong value, setting up and running an effective system is not always simple. Businesses often face technical and operational challenges that can affect data accuracy and overall results.
1. Data silos across departments
Data silos occur when teams store information in separate systems that do not connect, creating data isolation across the business. This makes it difficult to get a complete and consistent view of operations.
When data is fragmented, reports can show conflicting results. Teams may also spend extra time combining data manually, which increases the risk of errors.
2. Inconsistent data quality
Poor data quality can reduce the reliability of reports. Issues such as missing data, duplicates, or inconsistent formats make analysis more difficult.
Over time, outdated information can also affect accuracy. Regular checks and data management practices help maintain reliable reporting.
3. Limited data accessibility
Even when data is available, it may not be easy to access. In some cases, teams depend on IT to generate reports, which can cause delays.
Limited access can lead to manual workarounds and inconsistent data usage. Providing self-service tools and proper training helps teams access insights more efficiently.
Industry Use Cases for Business Intelligence Reporting
The versatility of business intelligence reporting lets it adapt to the needs of almost any sector. In retail, companies use BI tools to manage inventory, analyse customer buying habits, and run targeted marketing campaigns. Combining foot traffic and sales data helps adjust pricing and promotions to boost profits and reduce stockouts.
In healthcare, BI reporting supports critical decisions. Hospitals track readmission rates, bed occupancy, and staff schedules to prevent burnout. Clinical data analysis also helps improve treatment outcomes and patient care.
The financial sector depends on real-time intelligence for risk assessment, fraud detection, and portfolio management. Predictive models alert firms to market changes, helping protect client assets and guide investment strategies.
In manufacturing, BI reporting improves production efficiency. Companies monitor machinery performance, track supply chain delays, and forecast demand. Data-driven insights help reduce downtime, control costs, and maintain consistent product quality.
Essential Implementation Steps
Moving to a data-driven culture needs a careful, step-by-step approach. Rushing in can cause poor adoption and wasted effort. Companies should follow key steps to get lasting results.
- Define Clear Objectives: Identify the exact business problems you want to solve. Whether it’s cutting customer churn, speeding up supply chains, or improving financial forecasts, setting clear KPIs is essential.
- Audit Data Sources: Know where your important data lives, from CRM and ERP systems to marketing tools and old databases. Clean and govern your data from the start to avoid problems later.
- Select the Right Platform: Pick a BI tool that fits your budget, tech skills, and growth plans. Look for easy-to-use interfaces, strong integrations, and solid security.
- Deploy and Train: Introduce the platform in phases. Start with a pilot team, gather feedback, then train the wider staff to encourage active, confident use across the business.
Advanced Practices in Modern BI
As businesses develop stronger analytics capabilities, reporting moves beyond basic insights into more advanced use cases. These practices help businesses anticipate trends, reduce risks, and make faster decisions based on data.
- Predictive analytics uses historical data and statistical models to forecast trends and identify potential issues earlier.
- AI and machine learning help analyse large datasets and improve decision accuracy across operations.
- Natural Language Processing allows users to access insights using simple queries without technical expertise.
- Embedded dashboards integrate reporting into daily tools, making data easier to access and use in routine decisions.
"BI delivers the most value when insights are immediate and actionable. That’s where AI and embedded analytics make a real difference."
How Integrated ERP Software with BI Reporting Helps Australian Business
Integrating ERP software with business intelligence reporting allows businesses to connect operational data with real-time insights in one system. This makes it easier to track performance, reduce manual reporting, and make faster decisions based on accurate data.
With integrated systems, businesses can monitor finance, inventory, sales, and operations without switching between multiple tools. This improves visibility across departments and helps identify issues earlier before they impact performance.
The ABS reports that 85% of Australian businesses already use ICT, with 59% adopting cloud technology, yet only 4% use ERP software and 5% leverage data analytics. This gap highlights a clear opportunity for businesses to integrate ERP with BI reporting to unlock deeper insights and improve decision-making.
By combining ERP and BI, businesses can automate reporting, improve data accuracy, and respond more quickly to changes. This approach supports better planning, stronger control over operations, and more informed strategic decisions.
Conclusion
Even with vast amounts of data, businesses often struggle to turn it into clear insights. Modern BI reporting helps companies make sense of customer interactions, operations, and financials, supporting smarter decisions and faster responses to market changes.
By using BI tools, companies can optimise processes, spot trends early, and plan strategically. Ready to see how BI can transform your business? Book a free consultation today and explore the possibilities.

Frequently Asked Questions About Business Intelligence Reporting
Business intelligence is often referred to as BI, analytics reporting, or data analytics. These terms all relate to using data to generate insights for decision making.
A business intelligence report typically includes dashboards, charts, tables, and key performance indicators. The format focuses on making data easy to understand and interpret quickly.
Common BI tools include Power BI, Tableau, and Looker, along with integrated ERP systems that provide built-in reporting features. The choice depends on business needs and data complexity.
Data warehouses and cloud-based databases are commonly used for BI reporting because they can handle large volumes of structured data and support fast analysis.
Yes, SQL is widely used in business intelligence to extract, manage, and analyse data from databases. Many BI tools also use SQL in the background for querying data.