


Struggling to track timelines, manage task dependencies, or see who is responsible for what at a glance? Ever wondered why some projects stay on schedule while others drift without clear direction?
The Gantt chart dates back to the early 1910s, when Henry Gantt created it to help factories plan and control production. Its simple visual timeline made complex workflows easier to understand, coordinate, and monitor across teams.
Over time, the Gantt chart evolved beyond manufacturing and became a core tool in project management across industries. It remains relevant today because it turns plans into visible actions, which is why we know the Gantt chart now.
Key Takeaways
A Gantt chart is a visual project management tool that shows tasks, timelines, and dependencies to help teams plan, track, and manage work more effectively.
Timeline diagram components typically include tasks or events, start and end dates, milestones, dependencies, and time intervals displayed along a horizontal axis.
Singapore teams prioritize fast, precise delivery, lean coordination across vendors, and strong adoption of digital tools, supported by schemes like PSG that co-fund up to 50% of eligible costs for approved solutions.
Get to Know the Gantt Chart
In project management, the Gantt chart is the most often used. These diagrams help organize a project and determine the order in which activities must be completed. The chart is usually shown as a horizontal bar chart. The project timeline is shown as horizontal bars of varying lengths, each containing task sequences, durations, and start and finish dates for each job.
A Gantt chart helps schedule, manage, and monitor specific project activities and resources. The graph depicts the project timeline, showing the planned and completed work over time.
The Gantt chart helps project managers communicate project status and plans while ensuring that the project stays on schedule. In conclusion, this is beneficial for keeping activities on track when a big team and various stakeholders are involved, and the scope of work varies.
Read more: What is Business Analytic and How Can It Help You?
The Functions of Horizontal Bar Chart in Project Management
Essentially, Gantt charts offer several capabilities that may assist you in managing and monitoring firm projects, from large and complex to minor. Additional advantages of Gantt charts include the following:
1. Improved communication between team members
Firstly, you may use this chart to help your team communicate more efficiently. Additionally, you can use this chart to more simply determine the work distribution between groups. This, of course, enables you to deliver more relevant feedback or information to workers or team members.
2. Manage resources more efficiently using the Gantt chart
Secondly, as an employee or manager, you may efficiently manage resources by visualizing the activities and procedures that you must complete using a Gantt chart. You may arrange and split jobs based on the resources available. If done correctly, you can finish ongoing projects on schedule and within the budget allocated.
3. Benchmark project progress and improve time management
Thirdly, you may track project progress and improve time management. Aside from that, you may use a Gantt chart to track the progress of current projects. Additionally, using a predictive analytics dashboard, you can measure and evaluate which strategies to adjust if your project is late. Of course, having a clear timetable and setting time allotments for each task will help you improve your time management.
4. Increase workers’ sense of responsibility
Lastly, this graph can also help create a sense of responsibility in the workplace. The reason is that both the manager and the team can understand how the need for everyone to achieve their goals and tasks with the help of a Gantt chart is. In conclusion, managers can keep better track of which team members are delivering work that meets expectations and merits praise in this manner.
"A Gantt chart is more than a schedule. It clarifies task dependencies, assigns ownership, and shows the critical path so teams can spot bottlenecks early, reallocate resources fast, and keep delivery dates realistic."
Timeline Diagram Components
Generally, vertical sections in a Gantt chart indicate urgent activities. It shows the time spent on various duties. It’s easier using Microsoft Excel or Project Management System. If you made it using a system, it will have additional functionality. A more specific task description, real-time progress tracking, and schedule revisions are all possible. But first, you must understand the Gantt chart’s components:
1. Tasklist
This component, written vertically from top to bottom, explains the duties and tasks you must fulfill. You may do the tasks on this list sequentially or concurrently for each stage, individually or in a group. This way, job division, and employee duties will become more concentrated and addressed more rapidly. Easily monitor and track employee time usage per project and create analysis reports with the most complete Timesheet Management Software.
2. Timeline
In addition to the task list, the Gantt chart includes a timeline that details the timetable and work start and finish dates. This is usually written horizontally from left to right in the day, week, month, or year format. Use the timeline format for initiatives that span a lengthy period, either monthly or annually.
3. Dateline
This component consists of a line that indicates the current time and is situated in the center of the timeline. These lines are usually made in various striking colors to make it easier for employees to see the tasks they need to do. As a whole, this line helps to demonstrate the amount of completed work both now and in the future.
4. Bars
This component acts as a reminder of tasks that have already perform and their associated deadlines. As a bar chart illustrates, bars may also be thought of as a visual representation of your progress or the progress of the task you are now working on. That way, managers or superiors can more easily see the progress made by all employees.
5. Progress
The progress bar indicates how far the task has progressed and how much of it has been done by the relevant person or team. The progress shown in this Gantt chart is often portrayed as a percentage to make it simpler for management to assess how far the project has progressed.
6. Milestones
Milestones are components of a Gantt chart that show an ongoing plan at any given moment. Data points are the important dates and deadlines, start and finish times, or other key events in your project. The main function of milestones is to remind you and your team not to miss this important date.
7. Dependencies
This component acts as a link between two interrelated jobs. Moreover, it enables you to view the sequence in which activities must be accomplished from the beginning to the completion of a project by defining connections between them.
8. Resource assigned
Following completion of the task list and schedule of the execution time, the next step is to determine the person in charge of carrying out the work. This is what you should include in the section of the Gantt chart that represents the resources assigned.
Read more: Optimize Your Business with Project Management Software
Advantages and Disadvantages of Using Gantt Charts
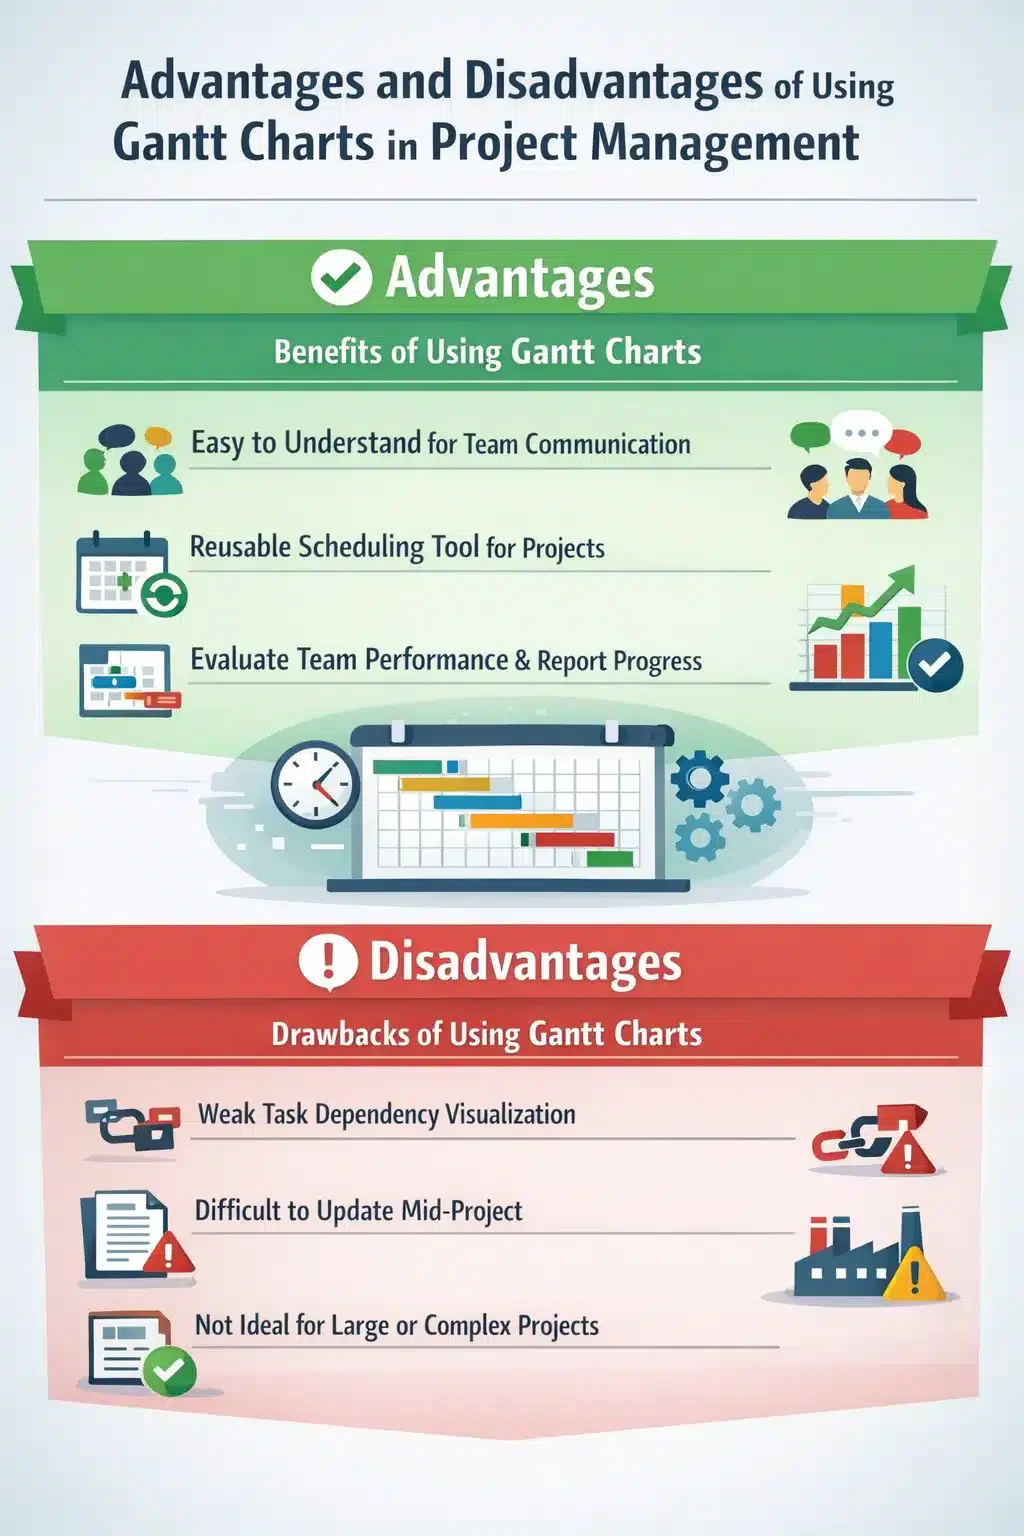
The following are the advantages of using Gantt charts in project management:
- Simple to comprehend to facilitate communication with the members involved.
- A simple project scheduling tool that you can reuse on the same project.
- You can use it to evaluate team performance and serve as a reference for reporting team progress.
However, some drawbacks of utilizing Gantt charts in project management include the following:
- It does not precisely illustrate the link between the two jobs. However, this results in project delays if relevant activities are not performed on schedule.
- Changes are difficult to make during a project because they may affect the plans for other tasks. As a result, any further modifications require creating a new chart from scratch.
- Not appropriate for high-complexity or large-scale projects.
To understand better, take a look at this infographic.
Project Management Practices in Singapore
Singapore’s business environment demands efficiency and precision in project execution. With one of the highest labour costs in Southeast Asia, companies here cannot afford project delays or resource wastage. Project managers typically rely on visual scheduling methods to coordinate multiple vendors and meet tight deadlines.
The digital adoption rate for project management tools in Singapore is notably high. According to the Singapore Digital Economy Report 2025 by IMDA, 95.1% of SMEs have adopted at least one digital solution in 2024, up from 94.5% in 2023.
For businesses considering digital project management tools, the Singapore government offers financial support through the Productivity Solutions Grant (PSG). This grant covers up to 50% of qualifying costs for approved digital solutions, making it more accessible for SMEs to upgrade their project planning capabilities.
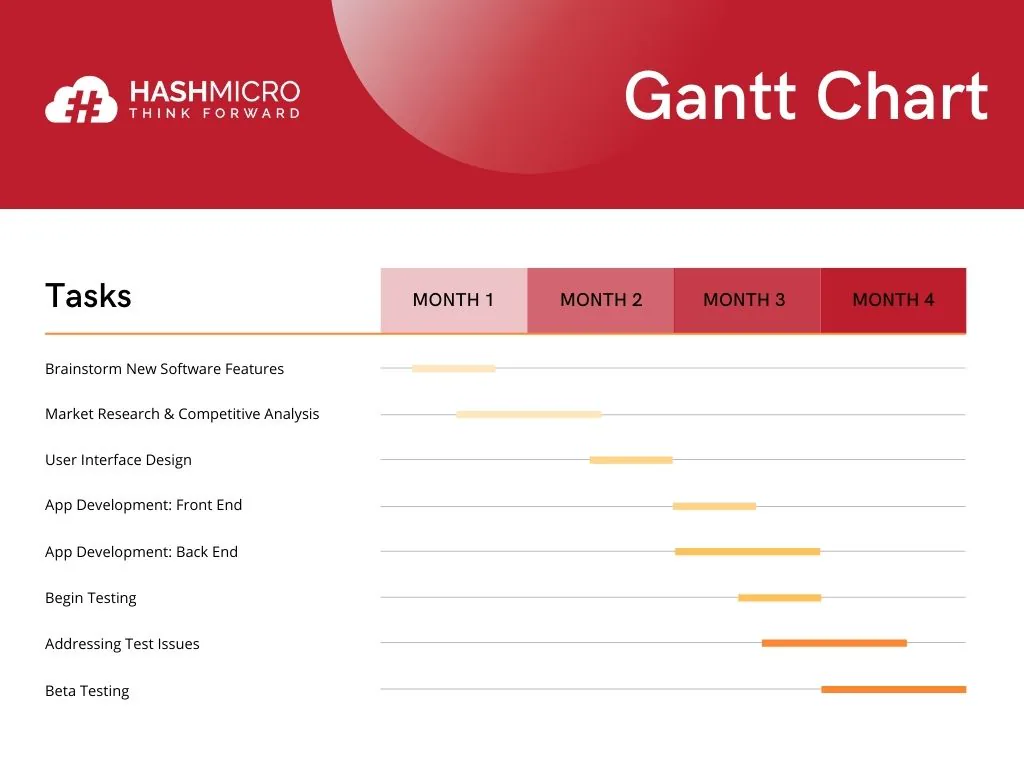
Examples of Project Scheduling Tool Templates
The examples and Gantt chart templates shown below might help you plan your company’s project management:
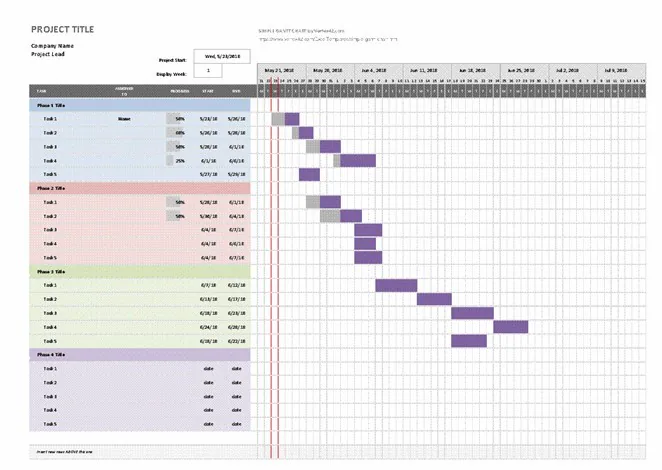
Example of Gantt chart using Excel
How Singaporean Enterprises Utilize Gantt Charts Within Project Management Tools
Take Unilever as an example. With regional operations in Singapore, it runs projects across product innovation, supply chain, marketing, and sustainability. Gantt charts help them turn complex workstreams into clear, time-bound execution plans.
- Coordinating product launches across regional markets
Unilever manages frequent product launches that involve R&D, packaging, regulatory checks, marketing, and distribution. Gantt charts help map each phase, define dependencies between teams, and ensure regional launches stay aligned with global timelines. - Synchronizing manufacturing and supply chain activities
With production spread across multiple facilities and suppliers, Unilever uses Gantt charts to align procurement, manufacturing runs, and logistics schedules. This visibility helps avoid bottlenecks. - Managing sustainability and compliance programs
Unilever’s sustainability initiatives, such as packaging reduction and responsible sourcing, involve long-term milestones and cross-functional teams. Gantt charts allow project managers to track progress against ESG targets while coordinating audits, supplier onboarding, and reporting deadlines. - Aligning marketing campaigns with operational readiness
Marketing timelines must match product availability and distribution readiness. Gantt charts help Unilever ensure campaign rollouts, promotions, and retail activation plans are synchronized with inventory readiness in key markets. - Supporting cross-functional collaboration at scale
Unilever projects often involve finance, operations, R&D, and external partners. Integrated Gantt charts within project management tools provide a shared timeline that keeps all stakeholders aligned, reduces miscommunication, and supports faster decision-making.
Conclusion
Gantt charts help businesses turn plans into visible timelines, clarify dependencies, and keep execution on track across teams. When implemented within project management tools, they improve coordination, accountability, and on-time delivery for both day-to-day operations and long-term initiatives.
Interested in taking your business to the next level with an integrated Gantt chart approach inside a project management system? Consult with our experts to map the right workflow, setup, and reporting structure for your teams.

FAQ About Gantt Chart
A Gantt chart helps you plan and monitor project work on a visual timeline. It shows tasks, start and end dates, milestones, dependencies, and who owns each task so progress is easy to track.
Teams often treat the Gantt chart as something they set once and forget. It also gets messy when it is overloaded with detail or when dependencies are ignored, which can trigger delays.
Avoid using a Gantt chart as the very first planning tool, as a replacement for resource management, or when you are building it manually and updating becomes a burden. It also fails when teams use it as a rigid “fixed” timeline instead of a flexible plan that adapts to change.