


Managing the right amount of stock is essential for any business that depends on inventory. This is why many companies rely on inventory forecasting to understand future demand and avoid shortages or excess stock. With accurate forecasting, decision-making becomes clearer, and operations run more smoothly.
Inventory forecasting analyzes historical sales, market trends, and demand patterns to estimate how much stock will be needed ahead of time. Many businesses improve this process through digital tools, which help generate more precise forecasts and keep inventory levels well-controlled.
In this article, we will explore the key types, benefits, and best practices for implementing inventory forecasting effectively.
Key Takeaways
Inventory forecasting is a process that companies use to estimate the amount of goods that will be needed to meet future demand.
As a process used to prepare future stock quantities, inventory forecasting itself is divided into several methods, such as graphical forecasting, trend forecasting, quantitative forecasting, and qualitative forecasting.
The application of demand forecasting brings benefits to the company, such as maximizing customer satisfaction, reducing costs and risks, and optimizing stock management.
What is Inventory Forecasting?
Inventory forecasting helps companies estimate future stock needs by analyzing sales history, seasonal trends, and lead times. This process reduces excess or insufficient inventory and keeps operations efficient. Without it, businesses risk stockouts, lost trust, and lower profits.
"All models are wrong, but some are useful."
Multiple Inventory Forecasting Methods

As a process used to prepare future stock quantities, inventory forecasting itself is divided into several methods. Here are some inventory implementation methods that you need to take a closer look at:
1. Graphical forecasting
The application of this method involves visualizing historical data in the form of graphs or diagrams to identify patterns or trends that may not be clearly visible in the raw numbers. Through graph visualization, companies can spot seasonal fluctuations and spikes in demand that may affect inventory decisions.
However, this method also has its limitations, especially if there are no clear trends or if the available data is too variable. In such situations, graphical analysis may need to be supplemented with quantitative or qualitative methods to get a more accurate picture.
2. Trend forecasting
Trend forecasting is a method for identifying emerging patterns or trends. For example, once, there was a trend on social media about an item with a certain engraving. Then, this forecasting method was effective.
However, trend forecasting also has weaknesses, especially in the event of sudden changes that do not match historical trends. For example, an unexpected event such as an economic crisis or a major change in consumer preferences can affect the accuracy of trend forecasting.
3. Quantitative forecasting
Quantitative forecasting is an inventory forecasting method that involves mathematical calculations such as moving averages, exponential smoothing, or regression analysis. Since this inventory forecasting is based on objective data, quantitative forecasting is often considered more accurate and reliable, especially when sufficient historical data is available.
However, this method has limitations in the event of significant changes in market conditions or other external factors that are not reflected in historical data. Therefore, it is important to combine quantitative forecasting with other analyses to get a more complete picture.
4. Qualitative forecasting
Qualitative forecasting relies on the judgment of industry experts, customer surveys, or focus groups to predict future demand. It is often used when historical data is unavailable or unreliable, such as for new products or emerging markets.
Since this method involves judgment rather than objective data, it is vulnerable to bias and subjectivity. Decisions taken based on intuition or personal opinion may not always reflect the broader market reality. Therefore, it is important to combine qualitative forecasting with other methods to minimize the risk of error.
Inventory Forecasting Formula
To implement inventory forecasting, companies need several important aspects or formulas that determine the accuracy of forecasting. Here are the formulas that you should pay attention to:
1. Calculating lead time demand
Calculating lead time demand involves analyzing historical sales data to estimate how much product will be sold during the lead time. By calculating the demand during the lead time, companies can ensure that they have enough stock to meet customer demand without experiencing shortages.
The application of this formula is essential to avoid situations where goods run out during the lead time period, which can lead to delivery delays and customer dissatisfaction. It also helps in better inventory planning, as companies can adjust their orders based on the actual demand estimated.
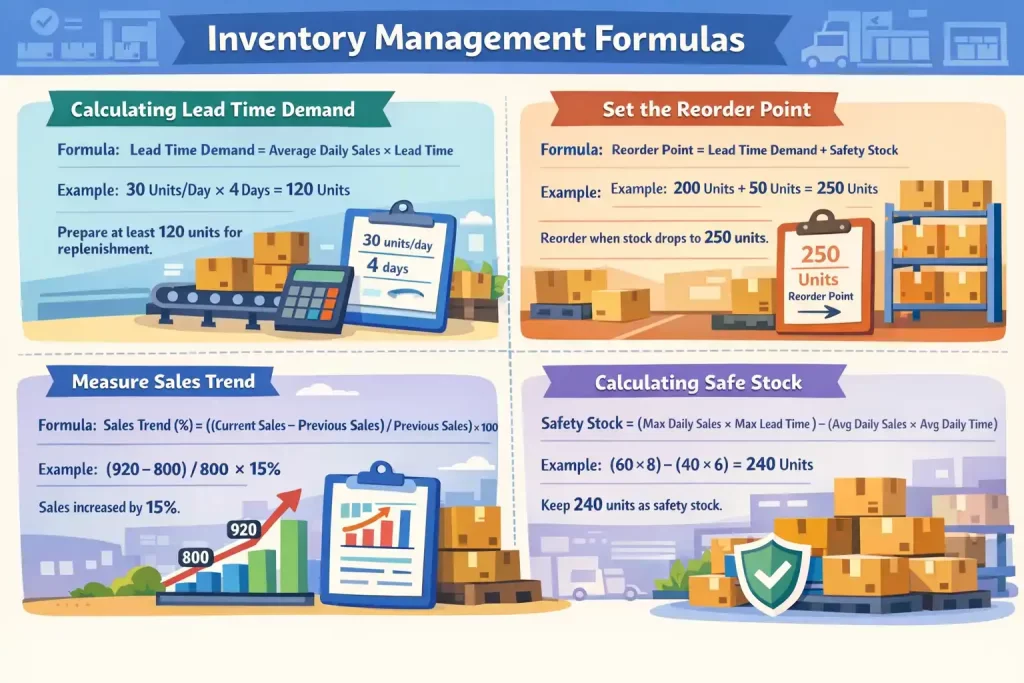
Formula:
Lead Time Demand = Average Daily Sales x Lead Time
Example:
If a company 30has units per day and the supplier’s lead time is 4 days, then:
Lead Time Demand = 30 x 4 = 120 units
This means that the company should prepare at least 120 units to cover demand during replenishment period.
2. Set the reorder point
What is a reorder point? Reorder point is the point at which a company should reorder goods to avoid stock-outs and ensure product availability when needed. By setting the right reorder point, companies can avoid stock-outs and ensure product availability for customers.
The right reorder point is crucial for maintaining operational efficiency and minimizing storage costs. If the reorder point is too low, the company risks running out of stock, while if it is too high, the company could face excess inventory that ties up capital and increases storage costs.
Formula:
Reorder Point = Lead Time Demand + Safety Stock
Example:
If lead time demand is 200 units and safety stock is 50 units, then:
Reorder Point = 200 + 50 = 250 units
This means the company should place a new order when inventory falls to 250 units.
3. Measure sales trend
To implement this step, the trends used could be gradual increases in sales, decreases, or seasonal fluctuations. By understanding these trends, companies can make better decisions regarding inventory management software, such as adjusting order quantities or reorganizing stock in the warehouse.
Measuring sales trends also helps companies to respond to market changes more quickly and efficiently. For example, if there is an increasing sales trend for a particular product, the company can increase the stock of that product to meet the increased demand.
Formula:
Sales Trend (%) = ((Current Period Sales – Previous Period Sales) / Previous Period Sales) × 100
Example:
If product sales were 800 units last month and 920 units this month, then:
Sales Trend (%) = ((920 – 800) / 800) × 100 = 15%
This means sales increased by 15%, which may indicate the need for higher inventory in the next period.
4. Calculating safe stocks
Safe stock serves as a buffer to avoid situations where a company runs out of stock due to a sudden demand increase or longer-than-expected lead times. By having safe stock, companies can be better prepared for unexpected fluctuations in demand or disruptions in the supply chain.
Formula:
Safety Stock = (Maximum Daily Sales × Maximum Lead Time) – (Average Daily Sales × Average Lead Time)
Example:
If:
- Maximum daily sales = 60 units
- Maximum lead time = 8 days
- Average daily sales = 40 units
- Average lead time = 6 days
Then:
Safety Stock = (60 × 8) – (40 × 6)
Safety Stock = 480 – 240 = 240 units
This means the company should keep 240 units as safety stock to reduce the risk of stockouts.
Advantages of Implementing Inventory Forecasting

Here are the benefits that companies can take from the implementation of inventory forecasting:
- Optimizing Stock Management: With inventory forecasting, companies can estimate stock requirements more accurately, thereby avoiding overstocking or understocking. This helps reduce storage costs and minimize the risk of product obsolescence.
- Improves Operational Efficiency: Companies that implement inventory forecasting can better plan production and procurement activities so that operational processes run more smoothly without interruptions due to shortages of materials or goods.
- Maximize Customer Satisfaction: By ensuring sufficient product availability based on demand forecasts, companies can meet customer needs on time, which increases customer satisfaction and loyalty.
- Reduce Costs and Risks: Inventory forecasting helps companies reduce costs associated with storing unnecessary goods and the risk of stock-outs, which can negatively impact sales and company image.
Tips to Implement Proper Inventory Forecasting and Minimize Errors
1. Use accurate historical data
Ensure the historical sales and demand data used in the inventory management system are complete and accurate. Good data allows companies to recognise patterns and trends that can be used to make more precise predictions, resulting in more effective stock management decisions.
2. Consider external factors
In addition to historical data, external factors such as market changes, seasonality, or consumer behavior that may affect demand must be considered. By considering these factors, companies can make forecasts that are more responsive to actual conditions on the ground.
3. Integrated with the right technology
Using inventory forecasting software for inventory forecasting can improve the accuracy and efficiency of the forecasting process. These technologies can help in processing large and complex data, provide deeper insights, and enable automation in making faster and more informed decisions.
Signs of Failing Inventory Forecasting

Inventory forecasting helps businesses maintain the right stock levels, protect cash flows, and support smoother operations. However, forecasting is practically useless until the effects start showing up in daily operations. Recognizing these warning signs early helps prevent recurring stock issues and costly decisions.
1. You frequently run out of fast-moving items
One of the clearest signs of poor forecasting is repeated stockouts, especially for products with stable or historically strong demand. This usually means the business is relying too heavily on assumptions instead of actual data like sales patterns, lead times, and reorder behavior.
Not only does this cause missing sales, but it also damages customer trust, pushes buyers toward competitors, and creates pressure on purchasing teams to make rushed replenishment decisions at higher costs.
2. You keep overstocking slow-moving products
Forecasting does not only fail when inventory is too low. It also fails when inventory is too high. Excess stock often ties up working capital, increases storage costs, and raises the risk of obsolescence or spoilage.
This problem usually appears when companies use outdated demand assumptions or fail to adjust forecasts after changes in customer preferences, seasonality, or product performance. As a result, the warehouse fills up with inventory that adds cost without generating enough return.
3. Your forecast rarely matches actual sales
If projected demand consistently differs from real sales, the company likely uses an inaccurate or overly simplistic forecasting method. For example, the team may rely only on past averages and ignore promotions, seasonality, supplier delays, or market shifts.
A forecasting process does not need to deliver perfect results, but it should stay reasonably close and improve over time. When actual results repeatedly miss the forecast by a wide margin, the company likely has a structural problem in how it collects data, builds assumptions, or reviews forecast performance.
4. Purchasing decisions feel reactive instead of planned
A weak forecasting process often forces businesses into reactive purchasing. Teams end up placing urgent orders, changing procurement plans suddenly, or scrambling to reallocate stock between locations because they did not anticipate demand correctly.
This creates unnecessary stress across departments. Procurement, warehouse, finance, and sales teams all become less efficient because they are constantly responding to surprises instead of following a stable inventory plan.
5. Carrying costs keep increasing without a clear reason
When storage expenses, insurance costs, spoilage, and capital lock-up continue rising, poor forecasting may be one of the hidden causes. Businesses sometimes blame warehouse capacity or supplier minimum order quantities, but the deeper problem is often inaccurate demand planning.
If the business keeps holding more inventory than necessary, it pays more to store, protect, and manage stock that is not delivering enough value. Over time, this reduces profitability even when sales still look healthy on the surface.
6. Different departments use different numbers
Forecasting becomes unreliable when different teams all work from different assumptions. Sales may expect a surge in demand, while procurement orders are conservative, and finance tries to control inventory spending without the full operational picture.
This disconnect leads to inconsistent decisions and makes the forecast less useful as a planning tool. Strong inventory forecasting depends on shared data, aligned assumptions, and regular coordination across functions.
7. You struggle during seasonal peaks or promotional periods
Repeatedly facing problems during holiday periods, campaigns, or peak seasons is another sign that the forecasting process is not capturing demand fluctuations well enough. Forecasting should help companies prepare for predictable spikes, not just react once demand has already increased.
Failing to account for these periods often results in lost sales on one side and panic ordering on the other. Both outcomes reduce efficiency and make growth harder to manage.
8. Inventory levels look high, but product availability is still poor
This is one of the most overlooked warning signs. A company may appear well stocked overall, but still lack the right items customers actually want. In other words, the business is carrying too much of the wrong stock and not enough of the right stock.
This usually points to poor SKU-level forecasting. Instead of looking only at total inventory volume, businesses need to forecast demand per product category, item type, or location to improve stock quality, not just stock quantity.
Conclusions
Forecasting is a process carried out by the company to get an idea of the amount of goods that must be prepared to meet customer needs in the future. Implementing this process relies on many formulas, such as historical order data and calculating the amount of safe stock. Therefore, inventory forecasting is not an easy process.
But the difficulties can be solved by being aware of the common signs of failing inventory forecast. Proactively implementing the inventory forecast meticulously ensures the data is correct and has been accounted for external factors. Utilising the right inventory management software can make the process of forecasting easier.
FAQ for Inventory Forecasting
FAQ
The 7 steps of forecasting usually include defining the purpose, gathering historical data, identifying demand patterns, selecting a forecasting method, calculating the forecast, comparing results with actual demand, and adjusting the model regularly to improve accuracy.>
You can calculate forecast inventory by estimating future demand based on past sales data, lead time, and safety stock. A common formula is: >Forecast Inventory = Expected Demand during Lead Time + Safety Stock. For example, if expected demand during lead time is >300 units and safety stock is >50 units, the forecast inventory needed is >350 units.>
The best forecasting technique depends on the business context, data quality, and demand pattern. For stable demand, moving averages or exponential smoothing often work well. For seasonal or trend-based demand, time-series methods are usually more effective. In practice, the best technique is the one that fits your data and consistently produces the most accurate results.>
The main rule of forecasting is that no forecast is ever perfectly accurate, so businesses should use forecasting as a guide rather than an absolute prediction. A good forecast should rely on reliable data, reflect current business conditions, and be reviewed regularly so the company can adjust when demand changes.>