


What is Sales Velocity?
Sales velocity measures how quickly your pipeline converts opportunities into revenue, expressed as a dollar amount per day or per month. It links sales activity to revenue outcomes, improves forecasting accuracy, and surfaces bottlenecks early.
Two metrics are often confused with it. Pipeline velocity describes how individual deals move through stages, not the full revenue-per-day figure. Lead velocity rate (LVR) tracks the month-on-month growth in qualified leads, making it a leading indicator of future sales velocity rather than the same metric.
The Sales Velocity Formula
Sales Velocity = (Number of Opportunities × Average Deal Size × Win Rate) ÷ Length of Sales Cycle
Each input maps to a number already tracked in most CRMs. Multiplied together and divided by your average sales cycle, the result is the dollar amount your pipeline generates per day (or per month, depending on the time unit you use).
The result represents revenue velocity, not revenue volume. A team closing RM50,000 in deals per day has a sales velocity of RM50,000 per day. Multiply that by your number of selling days per month to get a forward-looking monthly revenue estimate, which is one of the cleanest inputs for demand forecasting in a sales-led business.
Be explicit about your time units. If you measure sales cycle in days, your output is revenue per day. If you measure cycle in months, your output is revenue per month. Mixing them is the most common source of mistaken calculations. Most B2B teams report in days because daily granularity is more actionable for managing pipeline movement.
The 4 Components of Sales Velocity

Each input in the formula behaves differently when you try to move it. Treating them as one number hides the lever that is actually broken.
1. Number of Qualified Opportunities
A qualified opportunity is a prospect that has been validated as a real fit for your product, not just a raw inbound lead. The distinction matters because unqualified leads inflate the numerator and make your sales velocity look healthier than it actually is. A team showing 200 “opportunities” of which only 60 are truly qualified is reporting noise, not signal.
Most sales organizations apply a qualification framework like BANT (Budget, Authority, Need, Timing) to standardize what counts as qualified. Anything below that bar belongs in a nurture stream, not in active pipeline. Treating raw leads as opportunities also creates an opportunity cost where reps spend hours on prospects who will never close, time that could be spent on real deals.
2. Average Deal Size
Average deal size is total revenue from closed-won deals divided by the number of those deals over the same period. It tells you the typical contract value your team converts, which feeds directly into the velocity multiplication.
For subscription businesses, replace one-time deal value with Customer Lifetime Value (CLV). Recurring revenue models do not generate the bulk of revenue from a single transaction; they generate it across the customer relationship. Using initial contract value would systematically understate true velocity for any SaaS or subscription business.
3. Win Rate
Win rate is the number of deals won divided by total opportunities, expressed as a decimal in the formula. If you won 20 deals out of 50 qualified opportunities, your win rate is 0.40.
Use the same definition of “opportunity” you used in the first component, otherwise the two numbers will not align. Most teams calculate win rate on a rolling 90-day window so seasonal noise does not skew the figure.
4. Length of Sales Cycle
Sales cycle length is the average number of days from first meaningful contact to closed deal across your closed-won opportunities. It sits in the denominator of the formula, which means a longer cycle reduces velocity. Of the four components, this is the only one you want to decrease, not increase.
Measure from the first qualified interaction, not the first marketing touch. Including months of newsletter opens distorts the figure and hides where the real friction is.
How to Calculate Sales Velocity: Step-by-Step with Examples
Two worked examples make the calculation concrete. Substitute your own CRM numbers when working through these.
Example 1: B2B distribution business
A Malaysian industrial distributor reports the following from its CRM for the last 90 days:
- Qualified opportunities in pipeline: 120
- Average deal size (one-time order): RM18,000
- Win rate: 25% (or 0.25)
- Average sales cycle: 45 days
Step 1: 120 × RM18,000 = RM2,160,000 (total deal value in pipeline)
Step 2: RM2,160,000 × 0.25 = RM540,000 (weighted revenue)
Step 3: RM540,000 ÷ 45 = RM12,000
Sales velocity = RM12,000 per day. Across a 22 selling-day month, that translates to roughly RM264,000 in expected monthly revenue.
Example 2: SaaS business using CLV
A regional SaaS vendor reports:
- Qualified opportunities: 60
- CLV per closed customer: RM84,000 (over a 3-year average contract)
- Win rate: 30% (or 0.30)
- Average sales cycle: 30 days
Step 1: 60 × RM84,000 = RM5,040,000 (total CLV in pipeline)
Step 2: RM5,040,000 × 0.30 = RM1,512,000 (weighted CLV)
Step 3: RM1,512,000 ÷ 30 = RM50,400
Sales velocity = RM50,400 per day in lifetime contract value. Note the unit: this is CLV per day, not cash per day. For SaaS, this number tells you how fast you are locking in future recurring revenue, which is what makes the metric strategically useful for forecasting.
To convert daily velocity into a monthly revenue plan, multiply by the number of selling days in the target month. Most Malaysian sales teams use 20 to 22 selling days, depending on public holidays.
Why Does Sales Velocity Drop? Diagnosing Each Component
Sales velocity is most useful when you treat it as a diagnostic, not a vanity metric. When the number drops, the formula tells you exactly which lever is broken.
- Opportunities are declining
The problem is at the top of the funnel. Either B2B lead generation is producing fewer qualified prospects, or qualification standards have tightened and previously-counted leads are now being filtered out. Either way, the fix lives in marketing alignment, qualification criteria, or outbound effort, not in the closing motion. - Win rate is dropping
The issue is usually in the sales conversation itself: weak discovery, mismatched buyer fit, competitive positioning losing ground, or pricing pressure. Reps closing fewer of a steady pipeline often signal a need for re-training, better collateral, or a reset on which segments to pursue. A win-rate drop is rarely solved by lead-gen alone. - Average deal size is shrinking
You are either pursuing smaller accounts, failing to upsell at the close, or competing in markets where price compression is real. For Malaysian SMBs scaling into mid-market, this can also signal that the team is targeting too many small deals rather than landing fewer larger ones. - Cycle length is growing
There is friction somewhere in the process: approvals taking too long, proposals waiting on legal, or buyers stalling because the value case is not crisp enough. Cycle length captures the cumulative weight of every delay, so a growing number means delays have compounded over the last quarter.
Most teams benefit from monthly velocity tracking, with a quarterly deep-dive to spot structural issues. Monthly views catch tactical problems early, while quarterly views show whether a weak component is structural or one-off. If two components move in opposite directions in the same quarter, that is often where the most interesting operating insight lives.
7 Strategies to Increase Sales Velocity
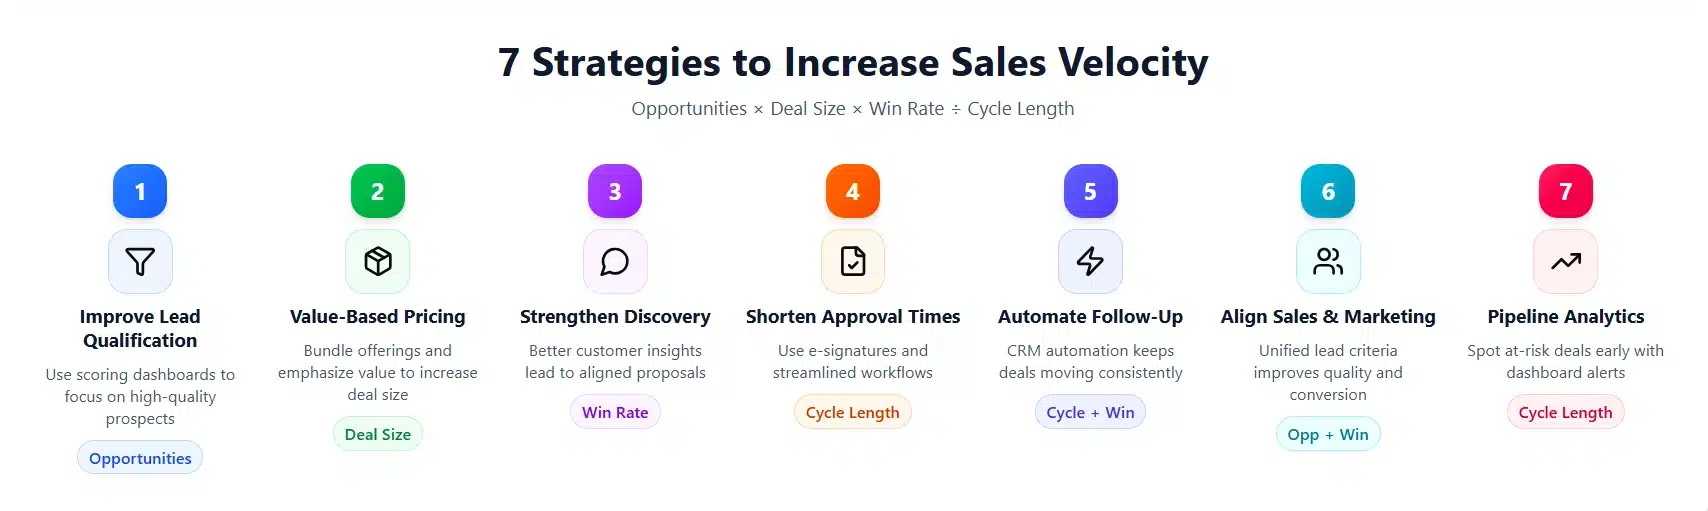
Each strategy is tied to a specific component of the formula so you can apply the one most relevant to where your velocity is weakest. The label in brackets shows which component each strategy moves.
1. Improve Lead Qualification (Component: Opportunities)
Tighten what counts as a qualified opportunity. Better-qualified pipeline reduces wasted rep time and prevents the win rate from being suppressed by deals that were never realistic. A standardized checklist or scoring rubric, applied at the same stage by every rep, removes the inconsistency that quietly degrades velocity.
2. Use Value-Based Pricing and Bundling (Component: Deal Size)
Move away from cost-plus pricing in segments where the buyer measures value, not cost. Bundle complementary products or service tiers to lift the typical contract size. For Malaysian B2B sellers, anchoring to operational ROI (cost saved, hours recovered) rather than feature count typically supports higher deal sizes.
3. Strengthen Discovery Conversations (Component: Win Rate)
Most win-rate problems start in discovery. Reps who confirm budget, decision criteria, and timeline early close more, because they walk away from poor-fit deals sooner and invest in good-fit ones harder. Discovery quality also feeds customer experience in the long run: buyers feel understood when reps ask the right questions, which compounds into renewal and referral value later.
4. Shorten Proposal and Approval Timelines (Component: Cycle Length)
Audit the time between customer approval and the signed contract. For many B2B sales teams, the process takes two to four weeks longer than it should. Pre-approved templates, faster legal turnaround, and electronic signatures reduce friction without changing anything else in the sales cycle.
5. Automate Repetitive Follow-Up (Components: Cycle Length + Win Rate)
Manual follow-up is one of the largest hidden taxes on velocity. Reps either spend time on it (hurting other activities) or skip it (hurting win rate). Modern CRM automation handles scheduled touchpoints, sequence reminders, and stage-based nudges so reps focus time on conversations that actually move deals.
6. Align Sales and Marketing on Lead Quality (Components: Opportunities + Win Rate)
Most velocity leaks happen at the marketing-to-sales handoff. Codifying what marketing must deliver before sales takes over (clear SLA on lead criteria, response times, and feedback loops) lifts both the number of qualified opportunities and the win rate of those opportunities. The biggest unlock is making it a two-way conversation, not a one-way pipeline dump.
7. Use Pipeline Analytics to Spot At-Risk Deals (Component: Cycle Length)
Stale deals are where cycle length quietly accumulates. Set up dashboard alerts for deals that have not moved stage in 14 to 21 days (depending on your average cycle), then intervene early. Killing or reviving a stalled deal is faster than letting it linger and slowly drag the average cycle length up.
How to Track Sales Velocity in a CRM?
The mechanics are simple once your CRM is set up correctly. Four data fields are essential opportunity count, deal value, close date, and won/lost status. Most modern sales management software captures these by default, but the discipline of filling them in consistently is what makes the calculation reliable.
To calculate the four components from CRM history:
- Opportunities
The number of qualified opportunities currently moving through the sales pipeline. To keep the calculation accurate, businesses should only count deals that have reached a qualified stage or higher, since early-stage leads may not yet show strong buying intent.Most companies track qualified opportunities over a rolling 90-day period to maintain a more realistic view of active pipeline performance. Inside a CRM sales system, this metric helps management understand whether the team has enough potential deals to support future revenue targets.
- Average deal size
Average deal size shows how much revenue is typically generated from each successful sale. This metric is calculated by dividing the total value of closed-won deals by the number of deals won within a certain period.Tracking average deal size inside CRM sales software helps businesses understand whether growth comes from closing more deals or securing higher-value contracts. It also helps sales teams identify opportunities for upselling and pricing improvement.
- Win rate
Win rate measures how effectively the sales team converts opportunities into paying customers. The calculation compares the number of closed-won deals against the total number of completed deals, including both won and lost opportunities.A declining win rate may indicate issues in lead qualification, pricing, or sales execution. By monitoring this metric in a CRM sales dashboard, businesses can identify weak points in the sales process and improve conversion performance.
- Cycle length
Sales cycle length measures the average time needed to move a prospect from the qualified stage to a closed-won deal. Longer sales cycles slow down sales velocity because revenue takes more time to materialize.Tracking this metric in CRM sales software helps businesses identify delays caused by approvals, negotiations, or slow follow-ups. This allows teams to improve efficiency and close deals faster.
Build a dashboard that recalculates these on a rolling 90-day basis and displays sales velocity as a single time-series chart. A weekly refresh is enough for most teams; daily refresh creates noise without insight.
CRM platform automates the velocity formula across the four components, surfaces trends per rep, region, or product line, and flags components that are drifting before the monthly number reflects it. That kind of automation removes the manual reporting overhead and frees the sales ops team for higher-leverage work.
Conclusion
In today’s more competitive Malaysian B2B market, tracking sales velocity helps businesses understand how efficiently their pipeline generates revenue. Beyond revenue targets and pipeline size, it helps companies identify which parts of the sales process are slowing growth, from weak lead quality to longer sales cycles.
By monitoring sales velocity consistently inside a CRM sales system, businesses can identify bottlenecks faster, improve pipeline efficiency, and make more accurate revenue decisions. This helps sales teams maintain stronger performance even in slower market conditions.
If your business wants to improve sales performance and gain better visibility into pipeline activity, using the right CRM sales software can make the process more effective. Explore our free demo to see how a CRM solution can help your team track sales velocity, automate follow-ups, and close deals faster.

FAQ about Sales Velocity
-
What is a good sales velocity benchmark?
There is no universal benchmark because sales velocity depends on deal size, cycle length, and industry. A useful baseline is your own velocity from the previous quarter; anything trending upward by 5 to 10 percent month-on-month is a healthy direction. Comparing across companies of similar size, segment, and ACV is more meaningful than chasing absolute numbers.
-
How often should you measure sales velocity?
Monthly is the most common cadence for sales teams, with a quarterly deep-dive to identify structural changes. Weekly measurement adds noise without much new information for most B2B sales cycles. The exception is high-velocity transactional sales (e-commerce, inside sales) where weekly tracking can be useful.
-
What is sales velocity for a SaaS business?
For SaaS businesses, replace average deal size with Customer Lifetime Value (CLV) in the formula. The result is CLV per day (not cash per day), which measures how quickly your pipeline locks in future recurring revenue. This is the more accurate metric for any subscription model where one-time transaction value misrepresents the customer’s true financial value.
-
How do you increase sales velocity without increasing headcount?
Focus on the three multiplicative components: opportunity quality, deal size, and win rate. Tighter qualification, bundling, and stronger discovery conversations lift velocity without growing the team. Automating follow-up and reducing proposal cycle time are usually the highest-ROI moves that do not require new hires.
-
Can sales velocity predict future revenue?
Yes, if used carefully. Multiply your daily velocity by the number of selling days in the forecast period to produce a baseline revenue estimate. It will not capture sudden market shifts or new product launches, so treat it as a directional forecast that you refine with pipeline and qualitative inputs.