


Waiting until the end of the month to review your finances is a luxury most businesses simply cannot afford. By the time the numbers are in, slow weeks have already passed, stockouts have already cost you sales, and cash shortfalls have already created friction.
A daily sales report solves this. It gives you a clear, granular picture of exactly what happened in your business every single day. Whether you run a single boutique or a multi-location restaurant chain, this daily discipline is what separates businesses that react to problems from those that prevent them.
Table of Contents
Key Takeaways
|
What is a Daily Sales Report?
A daily sales report is a comprehensive, structured summary of all financial transactions, operational metrics, and sales activities that occur within a business over a single 24-hour period. Unlike weekly, monthly, or annual financial statements, the daily report is an operational baseline. It captures the immediate reality of your business’s performance. It details exactly how much money came in, how much went out in refunds or voids, what specific products or services drove the revenue, and how customers chose to pay.
A daily sales report connects checkout activity with accounting records, giving businesses a clear view of sales performance across departments, product categories, or dayparts. It helps managers spot weak promotions, fast-moving items, and unusual sales patterns early, so they can act right away. At the same time, it gives store managers and executives one standardized metric to track results, strengthen accountability, and keep daily operations aligned with business goals.
The Core Components of an Effective Daily Sales Report

To extract meaningful insights from your daily operations, your report must go far beyond a single “total revenue” figure. A truly effective daily sales report is composed of several distinct metrics, each shedding light on a different aspect of customer behavior and operational efficiency. Understanding these components and their interaction is the foundation of advanced retail and hospitality management.
1. Gross Sales vs. Net Sales
The distinction between gross sales and net sales is perhaps the most fundamental concept in any sales report. Gross sales represent the absolute total of all transactions processed during the day, before any deductions are made. It is the raw, unfiltered measure of demand. However, gross sales can be highly misleading if viewed in isolation. If a store sells $10,000 worth of merchandise but processes $2,000 in returns, the gross figure paints an overly optimistic picture.
Net sales show the real revenue a business keeps after subtracting returns, allowances, voids, and discounts from gross sales. This figure reflects the amount available to cover costs, restock inventory, and generate profit. Monitoring the gap between gross and net sales each day helps businesses detect problems early, such as rising returns from quality issues or heavy discounting that weakens profit margins.
2. Transaction Volumes and Average Order Value (AOV)
Revenue figures alone do not show how busy your staff was. Transaction volume, or the number of individual purchases, gives a clearer view of customer traffic and daily workload. A store that earns $5,000 from 500 transactions operates very differently from one that earns the same amount from only 50 transactions.
You can measure average order value (AOV) by dividing net sales by transaction volume. This metric shows customer buying behavior and how well your team upsells or cross-sells. If transaction volume stays steady but AOV drops, customers buy less. If AOV rises, your merchandising, bundles, and staff recommendations are driving higher spending.
3. Tender Types and Payment Methods
A strong daily sales report should clearly separate revenue by payment type, such as cash, credit cards, debit cards, mobile wallets, gift cards, and BNPL options. This breakdown helps businesses track how customers prefer to pay and gives a more complete view of daily sales activity.
Tracking tender types also supports smoother reconciliation, since cash and electronic payments follow different handling processes. Separating payment types helps teams reconcile faster, match records accurately, and spot discrepancies more quickly. It also helps businesses monitor processing fees and spot shifts in customer behavior. For example, rising mobile wallet use may reflect a younger audience and support more digital-focused marketing decisions.
4. Voids, Returns, and Discounts
Negative figures on a daily sales report are often more informative than the positive ones. Voids occur when an item is removed from a transaction before the sale is finalized, while returns happen when a customer brings an item back after the purchase. Discounts encompass all price reductions, including promotional codes, employee discounts, and markdown items.
Tracking these metrics each day helps businesses catch inefficiencies and prevent fraud early. A high number of voids on one register may show that a cashier needs more POS training. Repeated post-transaction voids or frequent manual discounts can also signal unauthorized discounts or theft. By reviewing these numbers daily, managers can investigate unusual patterns right away while the situation remains clear and recent for staff.
5. Sales by Category and Top-Selling Products
To make smarter inventory and merchandising decisions, businesses need to track exactly what sells each day. A detailed sales report breaks revenue down by category, department, and individual SKU, giving teams a clear view of product performance. This level of detail helps them run a quick ABC analysis and identify your “A” products (high-value), “B” products (mid-value), and “C” products (low-value products) more accurately.
Tracking category performance helps businesses optimize floor space and inventory spending. When daily reports consistently show accessories selling better than outerwear, teams can easily give accessories more prime display space. Daily item-level insights also help them reorder top-selling products on time, maintain the right safety stock levels, and prevent stockouts that could cost profitable sales.
Why Your Retail or F&B Business Needs a Daily Sales Report
Implementing a rigorous daily reporting protocol requires time, discipline, and the right technology. However, the operational and strategic benefits far outweigh the administrative effort. These are the key reasons why daily report sales must be made:
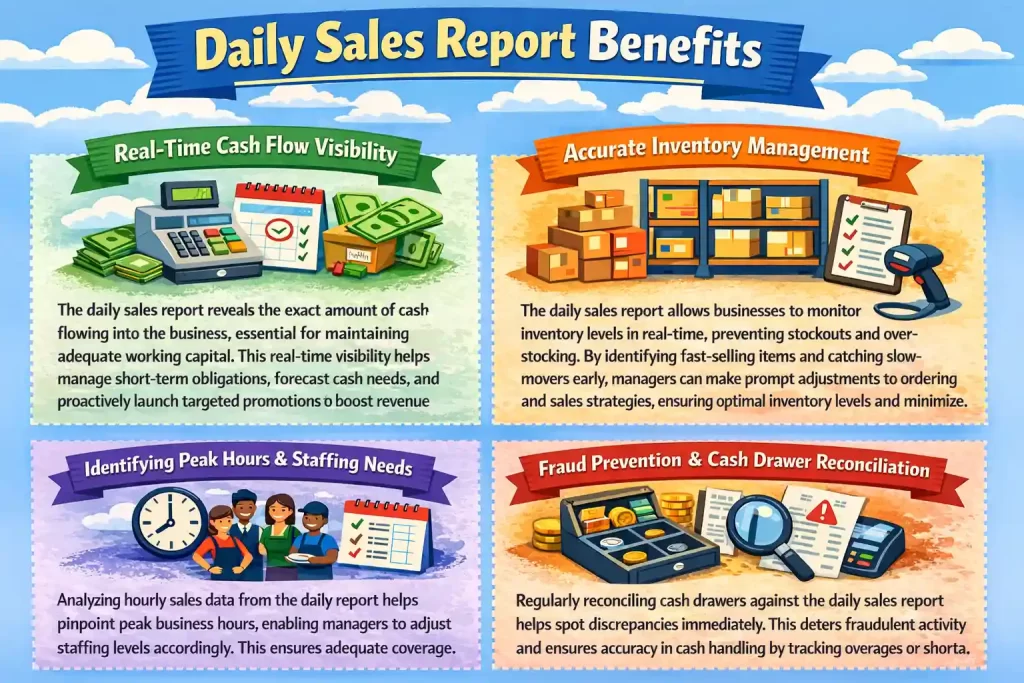
1. Real-Time Cash Flow Visibility:
- Shows how much cash enters the business each day.
- Helps owners manage working capital more accurately.
- Supports short-term obligations such as supplier payments, payroll, and utility bills.
- Prevents over-leveraging, especially for businesses with thin margins or rapid growth.
- Improves short-term cash flow forecasting before vendor invoices become due.
- Helps businesses spot slow periods early and launch promotions before revenue gaps grow.
2. Accurate Inventory Management:
- Updates stock levels based on daily item sales.
- Helps managers track inventory movement in real time.
- Prevents stockouts by flagging fast-moving items for immediate replenishment.
- Reduces overstocking by identifying slow-moving or stagnant products.
- Supports faster action on weak-performing items through markdowns or display changes.
- Prevents dead stock from tying up capital and storage space.
3. Identifying Peak Hours and Staffing Needs:
- Uses hourly or daypart sales data to improve staff scheduling.
- Helps managers match staffing levels with actual customer demand.
- Reduces labor costs caused by overstaffing during slow periods.
- Prevents poor service and lost sales during busy periods.
- Allows managers to assign top-performing staff during peak hours.
- Helps teams use off-peak time for restocking, cleaning, or inventory checks.
4. Fraud Prevention and Cash Drawer Reconciliation:
- Compares physical cash and electronic payment totals with the daily sales report.
- Helps managers detect shortages or overages quickly.
- Reveals patterns that may point to cashier errors or training gaps.
- Flags suspicious activity such as high void rates or frequent no-sale drawer openings.
- Supports immediate investigation while the shift is still fresh.
- Builds accountability and discourages internal fraud through daily checks.
Manual Reporting vs. Automated POS Analytics

As the importance of daily sales tracking has become universally recognized, the methods for generating these reports have evolved dramatically. Historically, daily reporting was a laborious, manual process. Today, modern technology has automated the heavy lifting, fundamentally changing how managers interact with their data.
The Disadvantages of Manual Spreadsheets
In the past, generating a daily sales report involved a manager sitting in a back office with a calculator, physical register tapes (Z-reports), stacks of credit card receipts, and a complex spreadsheet. They would manually input gross sales, subtract voids, tally up the cash, and calculate the day’s totals. While this method technically produces a report, it is fraught with inefficiencies and risks.
Manual data entry wastes valuable time and pulls managers off the sales floor, where they should support customers and guide staff. It also increases the risk of human error, so one typo can distort financial records and lead to bad decisions. On top of that, manual spreadsheets stay static and outdated, while deeper analysis, such as linking weather trends with category sales, demands even more manual work.
The Advantages of Real-Time POS Data
The advent of modern, cloud-based Point of Sale systems has revolutionized daily sales reporting. Today, advanced POS systems automate the aggregation of daily transactions seamlessly in the background. Every time a barcode is scanned, a touchscreen is tapped, or a credit card is swiped, the data is instantly recorded, categorized, and fed into dynamic, real-time dashboards.
Automated POS analytics remove manual data entry, virtually eradicating human error from the reporting process. It saves hours of administrative work by letting managers generate daily sales reports with one click. Cloud-based systems also give owners real-time access from anywhere, along with detailed filters for locations, employee performance, and year-over-year comparisons. As a result, the daily sales report shifts from a static record into an interactive tool that supports faster, more proactive decisions.
How to Analyze Your Daily Sales Data for Business Growth
Generating an accurate daily sales report is only the first step. The true value lies in how you analyze the data and translate those insights into actionable business strategies. Simply glancing at the total revenue figure is a wasted opportunity. To drive growth, you must interrogate the data, look for patterns, and ask the right questions.
1. Spotting Short-Term Trends and External Influences
Daily sales reports help you spot how external factors affect customer demand, from rainy days that increase delivery orders to extreme heat that reduces store visits. When you track these patterns over time, you can prepare ahead instead of reacting too late. For example, you can schedule more delivery staff, adjust stock, and respond faster to holidays. Adapt to sudden real-time local events or road disruptions that may impact daily sales.
2. Optimizing Pricing Strategies and Promotions
Daily sales reports let you measure the real impact of pricing changes and promotions as soon as they go live. Instead of waiting weeks, you can see whether a discount increases demand, improves sales, or hurts your margins immediately in your daily data. This quick feedback helps you test price elasticity, spot unprofitable campaigns, and change strategy based on actual customer response.
If you lower the price of a slow-moving item and see an immediate, sustained spike in daily transaction volume that offsets the lower margin, the price adjustment was successful. Conversely, if you run a heavy discount promotion but the daily report shows that your AOV has plummeted and overall net sales have barely moved, you know the promotion is cannibalizing your profits.
3. Enhancing Customer Experience and Operational Flow
Daily sales reports do more than track revenue. They help you spot service bottlenecks by examining the speed of service metrics and transaction volumes. For example, if sales drop after peak hours while voids or abandoned transactions increase, you may need faster service. Also, understanding the top-selling items on a daily basis will help you improve the overall experience. Using the data from daily sales reports, you can adjust stock and offerings based on what customers actually want and continuously improve your product mix and service delivery.
Common Pitfalls and How to Avoid Them
Even with the best intentions and the right technology, businesses frequently stumble when building a daily sales reporting routine. Here are the most common mistakes and ways to avoid them:
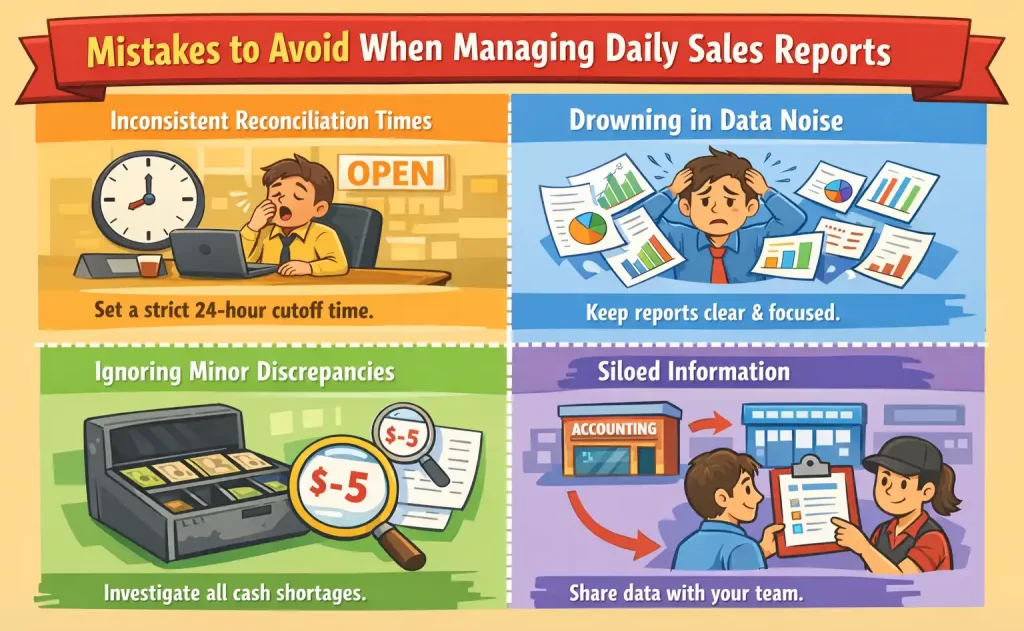
- Inconsistent Reconciliation Times: Failing to define a strict 24-hour reporting cutoff is one of the most frequent and damaging mistakes. If a tired manager postpones the closeout until the next morning after the store has already opened, early transactions from the new day bleed into the previous day’s report. Establish a hard cutoff time and enforce it without exception so that your data is not permanently distorted.
- Drowning in Data Noise: When a daily sales report tracks every micro-metric imaginable, it leads to analysis paralysis. Managers stop reading it because it is too overwhelming. Keep the daily report concise and focused on high-level, actionable insights. Save deep data mining for your weekly or monthly reviews.
- Ignoring Minor Discrepancies: A cash drawer short by five dollars might seem insignificant on a busy Tuesday. But over the course of a year, these small daily leaks compound into massive financial shrinkage. Investigate anomalies immediately to maintain a culture of accountability.
- Siloed Information: A daily sales report loses its operational value if only the accounting department sees it. The managers and shift leads physically on the floor need access to this data to make real-time adjustments. Share relevant performance metrics with the team members who have the power to act on them.
How to Implement an Accurate Daily Sales Reporting System
Transitioning to a disciplined daily reporting routine requires both the right technology and the right operational habits. Here is a practical framework to get it right from day one:
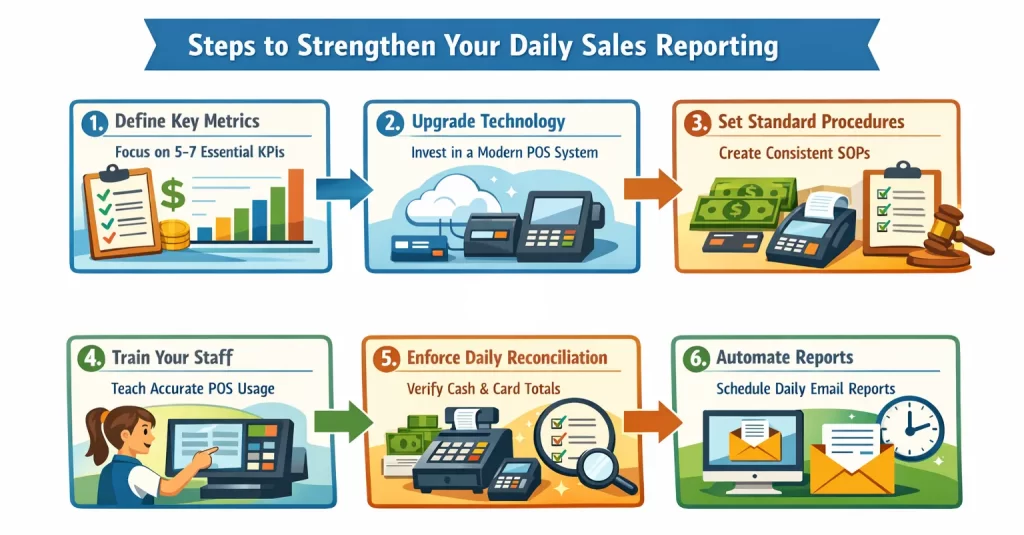
- Step 1: Define your key performance indicators (KPIs) and don’t attempt to track everything at once. Identify the five to seven metrics that directly impact your bottom line. This includes gross sales, net sales, total discounts, labor cost percentage, and transaction volume.
- Step 2: Upgrade your technology stack by investing in a modern, cloud-based POS system that automatically logs transactions, categorizes tender types, and integrates seamlessly with your accounting software. Manual data entry is the enemy of daily reporting.
- Step 3: Establish standard operating procedures (SOPs) as it is necessary for every employee to follow identical procedures for processing transactions, handling returns, and applying discounts. Do this by creating a strict, repeatable end-of-day routine for your staff, reconciling credit card batches, logging petty cash payouts, and submitting final numbers.
- Step 4: Train your staff on POS inputs to ensure that your employees understand not just how to use the POS system, but why accurate input matters. Like knowing that ringing up a “miscellaneous food” item instead of specifically selecting “blueberry muffin” completely skews inventory data and reorder reports. The most sophisticated reporting system cannot compensate for user error at the checkout counter.
- Step 5: Enforce rigorous end-of-day reconciliation, as any discrepancies must be documented, and reconciliation logs have to be reviewed daily to find patterns. The physical cash in the drawer plus the card terminal batch totals must be matched against the POS system’s expected totals every single day, preferably by two people for accountability.
- Step 6: Automate data delivery by configuring your POS or reporting software. Automation will relieve the burden of labor by generating and emailing the daily sales report to key stakeholders every morning. This ensures the data is reviewed before the new business day begins.
Industry-Specific Use Cases for Daily Sales Reports
The fundamental concept of tracking daily revenue remains consistent across the board; the specific application and focal points of a daily sales report vary significantly depending on your industry. Tailoring your reporting strategy to your sector ensures that the insights you gather are highly actionable and relevant to your unique operational challenges.
1. Retail and Apparel
In the retail sector, particularly fast-fashion or boutique apparel, daily sales reports are heavily utilized to monitor inventory turnover and promotional effectiveness. Store managers analyze daily data to track foot traffic conversion rates, average transaction values (ATV), and units per transaction (UPT).
If a new seasonal display was installed the previous night, the daily report will immediately indicate whether it successfully drove impulse purchases. Furthermore, tracking returns and exchanges daily helps retailers identify potential quality control issues with specific product lines before they result in widespread customer dissatisfaction.
2. Food and Beverage (F&B)
For restaurants, cafes, and bars, the daily sales report is the lifeblood of cost control. The F&B industry operates on razor-thin margins and deals with highly perishable inventory. Daily reports here focus heavily on daypart analysis, like comparing the profitability of the breakfast rush versus the dinner service.
Managers use these reports to track server performance (e.g., who is successfully upselling appetizers or premium beverages), monitor voided items, and manage labor costs as a percentage of daily sales. Identifying a sudden spike in food waste or complimentary items on a Tuesday night can prompt immediate retraining or menu adjustments by Wednesday morning.
3. E-commerce and Omnichannel
Digital storefronts and omnichannel retailers use daily sales reports to bridge the gap between physical and online operations. For these businesses, the report goes beyond gross revenue to include digital-specific metrics such as cart abandonment rates, traffic sources, and shipping costs.
When running a 24-hour flash sale or an influencer marketing campaign, e-commerce managers rely on daily (and even hourly) sales data to calculate immediate return on ad spend (ROAS) and ensure that fulfillment centers are adequately staffed to handle the incoming order volume.
Conclusion
Daily sales reports help businesses track revenue, inventory, staffing, and customer demand with better clarity each day. With consistent review, teams can catch issues early, protect margins, and improve daily decisions before problems grow.
To make reporting easier, businesses need a POS system that records transactions accurately and updates data in real time. That is why choosing the best POS system for daily sales reports matters. It’s not only a matter of prospering, but also survival in the competitive market.
FAQ for Daily Sales Report
-
How to prepare a daily sales report?
Prepare a daily sales report by recording total sales, net sales, transaction volume, payment methods, discounts, returns, and top-selling items. Reconcile cash and card totals, then review the data for patterns, issues, and actions before the next business day starts.
-
How do I write a sales report?
Write a sales report by summarizing key sales data clearly and logically. Include revenue, sales volume, customer trends, product performance, payment breakdowns, and operational issues. Focus on insights that help managers evaluate performance and make faster business decisions.
-
What does LDR mean in sales?
In sales, LDR can mean Lead-to-Deal Ratio, which measures how many leads convert into actual sales. Businesses use this metric to evaluate sales effectiveness, improve follow-up quality, and identify whether their sales process turns prospects into paying customers efficiently.
-
How to create a sales report in Excel?
Create a sales report in Excel by listing daily transactions in rows and using columns for date, product, quantity, sales value, discounts, returns, and payment type. Then use formulas, filters, and pivot tables to summarize performance and track trends accurately.