










 Limited to 100 registrants

Global retail shrinkage alone cost businesses $112 billion in 2022, according to Statista before accounting for the bigger drain of overstocks and dead stock. For Philippine businesses, tracking days of sales in inventory (DSI) is the clearest measure of how efficiently stock converts to revenue before it strains your cash flow.
DSI tells you the average number of days a company holds inventory before it is sold. A rising DSI even within industry norms signals mounting overstock that will eventually pressure margins and require discounting to clear.
This guide covers DSI's definition, formula, worked examples, how it compares to inventory turnover, industry benchmarks, strategies to bring it down, and how a modern inventory management system automates the whole tracking process.
Key Takeaways
DSI shows how long inventory takes to turn into sales. A lower DSI usually means faster turnover, lower holding costs, and healthier cash flow.
Using DSI helps you measure inventory efficiency, find weak points, and adjust stock strategies to improve cash flow and turnover.
Track your DSI monthly alongside the turnover ratio to catch slow-moving SKUs early before aging inventory compounds into a margin problem.
Modern inventory software calculates DSI automatically in real time, turning a lagging spreadsheet metric into an always-on signal your team can act on daily.
What is Day Sales in Inventory?

Days Sales in Inventory (DSI) calculates the average time it takes for a company to turn its inventory into sales. It covers all inventory types, including raw materials, in-process items, and finished goods ready for customers. Businesses rely on DSI to evaluate how efficiently they manage their stock and cash flow.
A lower DSI means faster turnover, leading to reduced storage costs and better cash flow for the business. Companies with high DSI might face challenges like overstocking or declining demand, which can negatively affect profits.
Understanding and managing DSI helps businesses maintain the right balance in inventory levels. Businesses applying just-in-time inventory management target the lowest achievable DSI, aligning purchases closely with actual demand to keep holding costs near zero.
Why DSI Matters

DSI is a powerful tool for understanding and improving your inventory management software. It shows how efficiently your business moves products, helping you identify potential bottlenecks. A high DSI can signal overstocking or slow sales, which might harm your profitability and cash flow.
Tracking DSI allows you to act before inventory issues escalate. By regularly monitoring this metric, businesses can optimize stock levels, prevent losses, and improve customer satisfaction. Whether you want to cut storage costs or enhance operational efficiency, keeping an eye on DSI is always essential.
How to Calculate DSI
The DSI formula requires two inputs: your average (or ending) inventory value and your cost of goods sold (COGS) for the period. The standard formula is:
Where:
- To compute Average Inventory, use beginning and ending balances for the period:
- Cost of Goods Sold (COGS): Direct costs of producing goods sold, including raw materials and labor.
- Number of Days: Typically 365 days in a fiscal year.
Example of DSI Calculation
The following walkthrough uses a Philippine electronics retailer with these inputs for fiscal year 2025:
- Beginning Inventory: ₱2,400,000
- Ending Inventory: ₱2,800,000
- Annual Cost of Goods Sold (COGS): ₱18,000,000
- Period: 365 days
This retailer holds stock for approximately 53 days before selling it. For the electronics sector, where a healthy DSI typically falls between 30–60 days, this result is within range.
However, a manager should still compare it to the previous period: a DSI that rose from 42 days to 53 days year-over-year despite stable COGS would signal a meaningful slowdown worth investigating.
DSI vs. Inventory Turnover
Days sales in inventory and inventory turnover measure the same underlying efficiency of how quickly a company cycles through its stock but from opposite directions. Understanding the relationship between the two helps you choose the right lens depending on whether you are talking to an operations team or an investor.
Inventory turnover counts how many times a company sells and replaces its entire inventory within a given period. A higher turnover rate generally signals stronger demand and leaner stock management. It is calculated as:
Inventory Turnover Formula
Using the retailer example: ₱18,000,000 ÷ ₱2,600,000 ≈ 6.9× per year
DSI is the direct reciprocal of inventory turnover, converting that ratio into a day count. If you already have the turnover rate, DSI follows immediately:
DSI from Inventory Turnover
Example: 365 ÷ 6.9 ≈ 52.9 days, consistent with the direct calculation above.
Here is a side-by-side comparison of when each metric is most useful:
| Metric | Unit | Best Used For | Higher Value Signals |
|---|---|---|---|
| DSI (Days Sales in Inventory) | Days | Operational planning, cash flow analysis, SKU-level diagnostics, perishables management | Slower inventory movement — potential overstock or declining demand |
| Inventory Turnover | Times per period | Investor reporting, annual benchmarking against industry peers, strategic reviews | Faster inventory movement — generally more efficient capital use |
In practice, finance teams typically report both together: inventory turnover as the headline efficiency ratio for stakeholders, and DSI as the day-to-day operational guide for warehouse and procurement managers. Neither metric alone tells the complete story, and the value of both rises sharply when trended over time rather than read as a single snapshot.
How to Use DSI to Manage Your Inventory

Days Sales in Inventory (DSI) measures how long it takes to sell your stock. By following these steps, you can better understand and use DSI to optimize your inventory control and improve your business performance.
Step 1: Calculate Your DSI
Start by finding your DSI using this formula:
This calculation shows the average number of days it takes to turn your inventory into sales.
Step 2: Evaluate Inventory Efficiency
Analyze your DSI value. A low DSI means your inventory moves quickly, which is ideal. A high DSI suggests your stock might be sitting too long and tying up cash.
Step 3: Compare with Industry Standards
Benchmark your DSI against similar businesses in your industry. This comparison helps you see if your inventory turnover is competitive or if you need to make changes.
Step 4: Identify Problem Areas
Use your DSI to pinpoint inefficiencies, such as overstocked products, poor demand forecasting, or slow-moving inventory. When a specific product category keeps climbing, schedule an inventory audit to verify counts and condition before adjusting procurement.
Step 5: Refine Inventory Strategies
Adjust your inventory plan based on your DSI.
- If DSI is high, reduce overstocking, optimize reorder points, and improve demand forecasting.
- If DSI is low, ensure enough stock is available to meet customer needs without delays.
Step 6: Monitor Cash Flow Impact
Track how changes in DSI affect your cash flow. A well managed DSI ensures your working capital isn’t tied up in excess inventory.
Step 7: Reassess Regularly
Regularly review your DSI to track progress and adapt to market trends. Inventory management isn’t a one time task it requires continuous optimization.
Some Ways to Reduce DSI
Here are some ways you could try to reduce your DSI level:
| Technique | Definition |
|---|---|
| Demand Forecasting | Predict customer needs accurately to avoid overstocking and only keep products that sell. |
| Just-In-Time (JIT) Inventory | Order inventory only when needed to reduce excess stock and storage costs. |
| Inventory Audits | Conduct audits to spot extra or slow-moving items and adjust stock levels quickly. |
| Economic Order Quantity (EOQ) | Find the best order size to balance costs and avoid unnecessary overstocking. |
| Leverage Automation | Use inventory management system to track stock accurately and reduce slow-moving products. |
Ideal DSI Range
There is no universal good DSI that applies to every business. A DSI of 15 days is excellent for a grocery chain but would be catastrophically understocked for a heavy-equipment manufacturer. What is considered healthy depends on industry, product type, sales cycle structure, supply chain geography, and demand variability.
The general principle holds that a lower DSI signals better liquidity and operational efficiency: stock converts to cash quickly, carrying costs remain low, and the risk of obsolescence is minimal. A higher DSI is not automatically a problem, it may reflect the natural nature of slow-moving, high-value categories but it demands monitoring to ensure it is by design, not by neglect.
In the construction sector, DSI tends to run higher because bulk material purchases precede project milestones, making construction inventory management considerably more complex than in retail or food.
The table below lists typical DSI benchmarks by sector, based on CSIMarket industry turnover data and CFI financial benchmarks:
| Industry | Typical DSI Range | Key Driver | Risk if DSI Rises |
|---|---|---|---|
| Grocery / Food & Beverage | 10–30 days | Shelf life, high purchase frequency | High — spoilage |
| Pharmaceutical & Health | 30–50 days | Regulatory compliance, expiry dates | High — expiry losses |
| Retail (General) | 20–60 days | Category mix, seasonal demand | Moderate — markdowns |
| Electronics / Technology | 30–65 days | Product lifecycle, rapid obsolescence | Moderate — devaluation |
| Automotive | 35–70 days | Unit cost, build-to-order cycles | Moderate — carrying cost |
| Manufacturing & Industrial | 60–100 days | Raw material lead times, production cycles | Lower — long cycle is normal |
| Luxury Goods / Fashion | 60–150+ days | Limited-edition volumes, brand positioning | Lower — intentional positioning |
| Aerospace / Heavy Equipment | 90–200+ days | Long production lead times, bespoke orders | Lower — expected by nature |
The Role of Technology: Dashboard Integration for Optimizing DSI
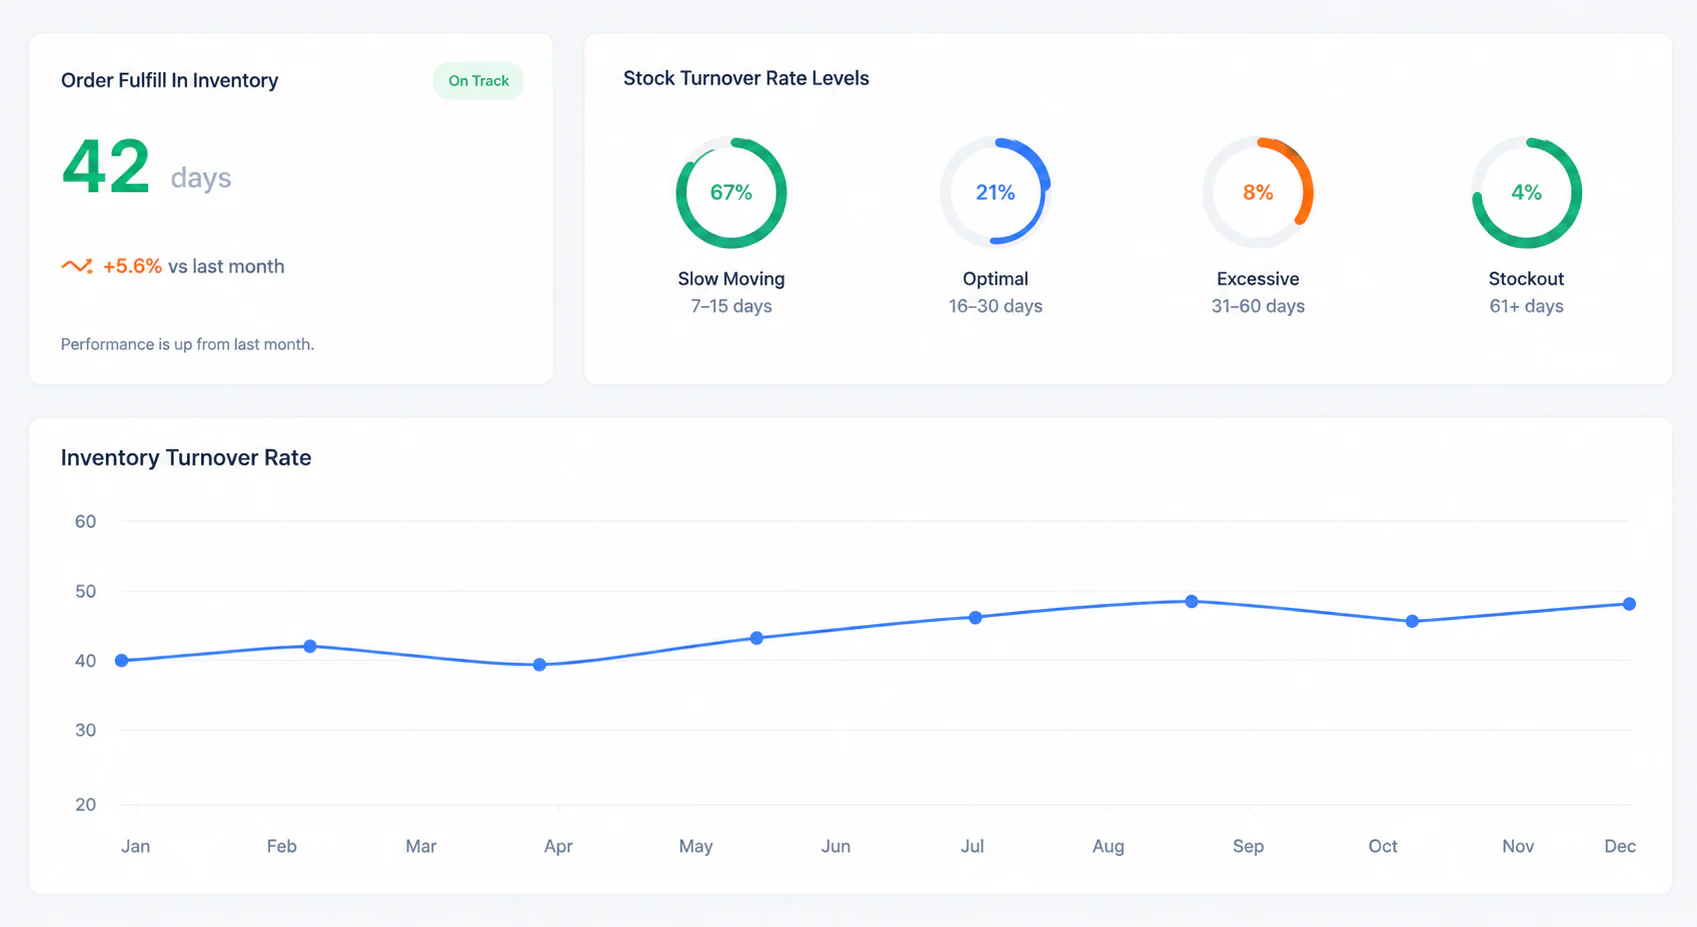
Technology, through dashboards and integrated software, helps manage DSI by providing real-time insights into stock levels, turnover rates, and performance. These dashboards automate tracking, alert for reorders, and identify slow-moving items, reducing manual errors.
With tools like QR codes, barcode scanners, and analytics, businesses can optimize inventory management, improve demand forecasting, and maintain an ideal DSI, ensuring smoother operations and better cash flow.
HashMicro's inventory management system brings this integration to Philippine businesses of every size. With AI-powered demand forecasting built in, HashMicro helps operations teams move from reactive inventory firefighting to proactive, data-driven stock control, reducing carrying costs while maintaining the service levels customers expect.

Conclusion
Days Sales in Inventory clearly shows how long your stock sits before turning into revenue. It helps you manage inventory more efficiently, ensuring consistently smoother operations and steady cash flow. By fully understanding DSI, you improve overall profitability, prevent wasteful overstocking, and deliver exceptional customer satisfaction.
Companies that benchmark continuously are far better positioned to catch slow movers early, right-size safety stock, and free up capital that would otherwise sit idle on shelves. For a broader look at how strong inventory control drives business outcomes, explore the benefits of inventory management for growing Philippine businesses.
Maintain an ideal DSI range by applying smart strategies, leveraging robust tools, and analyzing stock movements regularly. With proper DSI management, you reduce costs, enhance resource allocation, and achieve more reliable business growth.

FAQ Around Days Sales in Inventory
DSI measures how long it takes to sell inventory, while DSO calculates the average time to collect receivables. Both metrics impact cash flow but focus on different areas of business operations.
A higher DSI typically indicates slower inventory turnover, which can lead to higher storage costs. It’s better to aim for a balanced DSI to keep inventory moving efficiently without overstocking.
To reduce DSI, improve demand forecasting, streamline stock management, and optimize reorder points. You can also use techniques like Just-In-Time inventory to keep stock levels low and turnover high.