


In finance, revenue and gross profit only tell part of the story. If you want to understand whether a company is actually creating value, you need to look at how well it turns shareholder capital into profit. That is where return on equity becomes important, because it shows how efficiently a business uses the money invested by its owners.
More than just a formula, return on equity gives you a clearer view of business performance from several angles at once. It connects profitability, capital use, and financial structure in one ratio, which is why it is often used to evaluate management quality and long term business strength. When you read it properly, this metric can tell you whether a company is growing through real efficiency or simply relying on financial leverage.
If you want to understand what makes return on equity useful, how to calculate it correctly, and why the number should never be read in isolation, keep reading. This article will walk you through the formula, practical examples, key drivers, and the warning signs you should not ignore before using ROE in any financial analysis.
Key Takeaways
|

What is Return on Equity (ROE)?
Return on equity, or ROE, is a key financial metric that measures how profitable a business is compared to the equity held by its shareholders. In simple terms, it shows how much profit a company generates for every dollar of shareholder capital.
To understand ROE clearly, you need to look at two main components: net income and shareholders’ equity. Net income is the final profit left after expenses, taxes, interest, and depreciation are deducted from revenue, while shareholders’ equity is the value that remains after total liabilities are subtracted from total assets.
When those two figures are combined in one ratio, you get a clearer view of how efficiently a business uses its capital. A high ROE usually points to stronger profit generation, while a low ROE can signal weak margins, inefficient capital use, or pressure from the industry itself.
The Formula Behind Return on Equity
The formula for calculating return on equity is fairly simple, but the figures behind it need careful attention to ensure accuracy and comparability across different periods and organizations.
Return on Equity = Net Income / Average Shareholders’ Equity
To understand how this formula works, it helps to break down each component more clearly:
1. Net Income
The numerator of the equation is net income. For a more accurate return on equity calculation, analysts typically use the net income applicable to common shareholders. This means that if a company has issued preferred stock, any dividends paid to preferred shareholders must be subtracted from the total net income before performing the calculation.
This is because preferred equity functions somewhat like debt, as it carries a fixed dividend requirement, and that amount should be removed to show the return generated specifically for common shareholders. Furthermore, it is crucial to use net income from continuing operations, excluding any one time, extraordinary items or gains or losses from discontinued operations, as these can distort the true, recurring profitability of the core business.
2. Average Shareholders’ Equity
The denominator is shareholders’ equity. However, because net income is a flow variable measured over a period of time, usually a fiscal year, and equity is a stock variable measured at a specific point in time, using only the ending equity balance can lead to mismatched data. A company’s equity base can fluctuate significantly throughout the year due to share issuances, share repurchases, or dividend payments.
To correct this mismatch, financial professionals use the average shareholders’ equity for the period. This is most commonly calculated by adding the beginning shareholders’ equity, which is the ending equity of the previous year, to the ending shareholders’ equity of the current year, and dividing the sum by two. For a more precise result, especially in seasonal businesses or companies going through rapid capital changes, analysts may use a weighted average based on quarterly or monthly equity balances.
A Simple Return on Equity Example
To show how this works in practice, let us use a fictional manufacturing company, Apex Industrial Corp., and walk through its return on equity calculation for the fiscal year ending December 31, 2023.
Step 1: Determine Net Income
Based on Apex Industrial Corp.’s 2023 income statement, the company reported total net income of $15,000,000. The company also paid $2,000,000 in preferred dividends during the year. As a result, the net income available to common shareholders is $13,000,000 ($15,000,000 minus $2,000,000).
Step 2: Determine Average Shareholders’ Equity
Next, we review the company’s balance sheets. At the end of 2022, which is the beginning of 2023, total shareholders’ equity stood at $50,000,000. By the end of 2023, total shareholders’ equity had increased to $60,000,000 due to retained profits and a small share issuance. Since preferred equity stayed at $10,000,000 throughout the year, that amount also needs to be deducted.
Beginning Common Equity = $50,000,000 minus $10,000,000 = $40,000,000
Ending Common Equity = $60,000,000 minus $10,000,000 = $50,000,000
Average Common Equity = ($40,000,000 + $50,000,000) / 2 = $45,000,000
Step 3: Calculate the Ratio
Now, we apply the formula:
ROE = $13,000,000 / $45,000,000 = 0.2888, or 28.88%.
This means that for every dollar of common equity invested in Apex Industrial Corp., the company generated nearly 29 cents in profit during the year. At first glance, that looks like a very strong result, but it still needs to be viewed alongside industry benchmarks and the company’s historical performance.
Why Return on Equity Matters in Financial Analysis

Return on equity is widely considered one of the most important metrics in corporate finance for several compelling reasons. It serves as a comprehensive scorecard for executive management, reflecting their ability to balance profitability, asset utilization, and financial leverage.
From an investor’s perspective, this metric is the direct link between company performance and shareholder wealth creation. When an individual buys stock in a company, they are essentially providing equity capital. The return on equity tells them exactly how efficiently their capital is being put to work.
A company that consistently generates high returns on its equity base can reinvest those profits at high rates of return, leading to compounding growth in intrinsic value over time. To understand a company properly, you need to look at ROE alongside other performance indicators used in financial analysis, even though this metric often remains one of the most closely watched.
For corporate management, this ratio is a primary target for performance evaluation and executive compensation. Management teams are often incentivized to maximize shareholder value, and increasing the return on equity is one of the most direct ways to achieve this. It pushes executives to focus not just on growing sales, but on improving profit quality, using assets efficiently, and managing the company’s capital structure with more discipline.
Return on Equity vs. Return on Assets (ROA)
While return on equity focuses only on the capital provided by shareholders, it is not the only profitability metric that matters. To get a complete picture of management’s effectiveness, it is essential to compare it alongside other metrics. That is why comparing ROE with asset based profitability can give you a more complete view of business performance.
ROA measures how efficiently a company generates profits from its total asset base, regardless of whether those assets are financed by debt or equity. The formula for this metric is Net Income divided by Average Total Assets.
The relationship between ROE and ROA is heavily influenced by financial leverage. Because Total Assets equal Liabilities plus Shareholders’ Equity, a company with zero liabilities will have an ROE that is exactly equal to its ROA. However, as soon as a company takes on debt, its asset base becomes larger than its equity base. Consequently, assuming the company is profitable, its ROE will be higher than its ROA.
Looking at the gap between these two metrics can reveal a lot. A wide gap between a high return on equity and a low ROA is a clear warning sign that a company’s strong returns may be driven more by aggressive borrowing than by operational strength. Conversely, a company with strong, closely aligned ROE and ROA figures is likely generating higher quality earnings through efficient operations and more disciplined balance sheet management.
Understanding ROE Through DuPont Analysis
While a single percentage can be useful for a quick assessment, it does not fully explain what is driving a company’s performance. A high return on equity could come from strong operational efficiency, but it can also be inflated by excessive debt. To understand where a company’s returns really come from, financial analysts often use a method called the DuPont Analysis, named after the company that popularized it in the 1920s.
The DuPont model breaks down the basic return on equity formula into three distinct components: Net Profit Margin, Asset Turnover, and the Equity Multiplier. By looking at each part separately, analysts can identify more clearly where a company’s strengths and weaknesses come from.
1. Net Profit Margin (Operating Efficiency)
The first component is the Net Profit Margin, calculated as Net Income divided by Total Revenue. This ratio measures a company’s operating efficiency and pricing power. It answers the question: For every dollar of sales generated, how much ends up as actual profit?
A high net profit margin indicates that a company has strong control over its operating costs, possesses pricing power over its customers, or operates in a high value niche. If return on equity rises because profit margins are improving, that is often seen as a positive and more sustainable sign.
2. Asset Turnover (Asset Use Efficiency)
The second component is Asset Turnover, calculated as Total Revenue divided by Average Total Assets. This metric measures how efficiently a company uses its assets to generate sales. It answers the question: For every dollar of assets the company owns, how many dollars of revenue are generated?
Businesses with low profit margins, such as grocery store chains or discount retailers, usually make up for that by maintaining high asset turnover. Conversely, capital intensive businesses with low asset turnover, such as utility companies, must maintain higher profit margins to achieve a respectable return on equity.
3. Equity Multiplier (Financial Leverage)
The final component is the Equity Multiplier, calculated as Average Total Assets divided by Average Shareholders’ Equity. This is a measure of financial leverage. It indicates how much of a company’s assets are financed by debt rather than equity.
If a company has no debt, its total assets will equal its total equity, and the equity multiplier will be 1.0. As a company takes on more debt to finance its assets, the equity multiplier increases. While higher leverage can lift return on equity mathematically, it also increases financial risk.
When you multiply these three components together, the revenues and the assets cancel out mathematically, bringing you right back to the original formula:
(Net Income / Revenue) x (Revenue / Assets) x (Assets / Equity) = Net Income / Equity
Using the DuPont Analysis makes it easier to see why two companies can report the same return on equity but carry very different risk profiles. Company A might achieve a 15% return through high profit margins and low debt, while Company B achieves the same 15% return through razor thin margins but massive amounts of debt.
That breakdown helps show why Company A would usually be seen as the stronger and lower risk business.
The Five Step DuPont Model
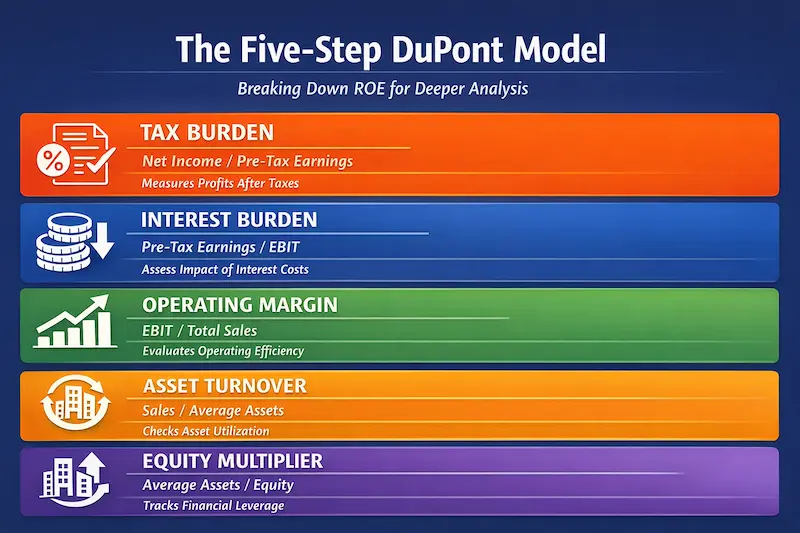
For a more detailed view, analysts often use the five step DuPont model. This version breaks Net Profit Margin into three smaller parts, making it easier to separate the effects of taxes and interest expenses from core operating performance.
The five components are:
Tax Burden: Net Income / Pre Tax Income. This shows how much profit remains after income taxes are paid. A higher figure usually points to a lower effective tax rate.
Interest Burden: Pre Tax Income / Earnings Before Interest and Taxes (EBIT). This shows how much operating profit remains after interest payments on debt. A higher figure suggests lower interest expense relative to operating earnings.
Operating Margin: EBIT / Total Revenue. This is a measure of operating profitability, without the effects of the company’s financing structure or tax environment.
Asset Turnover: Total Revenue / Average Total Assets. This works the same way as in the three step model.
Equity Multiplier: Average Total Assets / Average Shareholders’ Equity. This also works the same way as in the three step model.
This expanded model is especially useful when comparing multinational companies operating under different tax rules or businesses with very different debt structures. By isolating operating margin, analysts can compare the core operating efficiency of competing firms before taxes and interest begin to affect the final result.
The Impact of Debt on Return on Equity
One of the most important parts of analyzing corporate profitability is understanding how financial leverage can work in two very different ways. Because shareholders’ equity is the denominator in the ROE equation, any action that reduces equity relative to assets will mathematically increase the ratio, as long as net income remains positive.
When a company borrows money, it increases its liabilities and its assets in the form of cash, while its equity stays unchanged at first. If that borrowed cash is invested in projects that generate returns above the interest cost, the extra profit flows to the bottom line and lifts net income. Because net income rises while equity stays the same, return on equity also moves higher. This is the positive side of leverage.
However, this mathematical boost also comes with serious risk. Debt creates fixed interest obligations that still need to be paid no matter how the business performs. In an economic downturn, a highly leveraged company may see operating profit fall sharply while interest expenses remain fixed. A company with a dangerously high level of debt compared to equity may show strong ROE during good times, but it can become far more vulnerable during a recession.
Furthermore, taking on too much debt can push net income into negative territory. If interest payments rise above operating profit, the numerator in the ROE equation turns negative, which leads to a negative return on equity. That is why smart investors do not look at ROE alone. They also examine debt levels to judge whether the return is sustainable or built on a weak foundation.
How Retained Earnings Affect Return on Equity
A company’s dividend policy, accumulated profits kept in the business, and return on equity are closely connected in corporate finance. When a company generates net income, the board of directors must decide how to use those profits. They can either distribute the cash to shareholders as dividends, or keep the profits in the business to support future growth.
The amount kept in the business plays an important role in how ROE changes over time. When profits are retained, they are added to shareholders’ equity on the balance sheet. This increases the denominator in the ROE equation. If a company keeps a large share of its earnings, its equity base will grow quickly. To maintain its historical return on equity, the business must invest that money into projects that can generate profits at the same rate or higher.
This leads to the concept of the Sustainable Growth Rate, or SGR. The SGR is the maximum rate at which a company can grow its sales and earnings without issuing new equity or increasing financial leverage. This formula is closely linked to ROE:
Sustainable Growth Rate = Retention Ratio x Return on Equity
The retention ratio is calculated as 1 minus the dividend payout ratio.
For example, if a company has a return on equity of 20% and pays out 40% of its earnings as dividends, its retention ratio is 60%. Its sustainable growth rate would be 12% (0.60 x 20%). That means the company can grow its earnings by 12% per year using only the profit it generates internally.
But keeping more profit does not automatically improve performance. If management fails to invest that money effectively, net income will not grow fast enough to match the larger equity base. As a result, return on equity will gradually decline over time.
This often happens in mature companies that no longer have many strong growth opportunities. In that situation, returning excess capital to shareholders through dividends or share repurchases is often a better move than leaving it idle on the balance sheet.
The Downsides of Using ROE Alone
While return on equity is a useful analytical tool, relying on it alone can lead to misleading conclusions about a company’s financial health. This metric has several limits and can be distorted in ways that analysts need to understand clearly.
1. The Illusion of Share Buybacks
In recent years, share repurchase programs have become much more common. When a company buys back its own stock, it uses cash to reduce the number of shares outstanding, which also reduces shareholders’ equity. Because the denominator in the ROE formula becomes smaller, return on equity can rise even when net income stays flat or declines slightly.
Share buybacks can still be a valid way to return capital to shareholders, but they can also create the appearance of stronger performance. A company may report a record high ROE, even though that increase comes mainly from debt funded repurchases rather than real business growth.
2. Asset Write Downs and Impairments
Asset write downs can also distort ROE. When a company reduces the value of inventory, machinery, goodwill, or other assets, that loss lowers equity on the balance sheet. Once equity falls, ROE can look stronger mathematically even if the business itself has not improved.
This is why ROE should never be read without context. If a company has gone through large impairments or accounting adjustments, the ratio may look better on paper while the underlying business remains under pressure.
Practical Ways to Improve ROE
For management teams, improving return on equity takes more than watching one number. It requires a structured approach that looks at profit, asset use, and capital allocation together.
- Step 1: Standardize Data Collection
Start with a consistent reporting method using trailing twelve month net income and average quarterly equity. This helps smooth seasonal swings and gives management a more reliable baseline to work from. - Step 2: Apply the DuPont Framework
Break ROE into its core drivers: Net Profit Margin, Asset Turnover, and Financial Leverage. This makes it easier to see where the business is underperforming and where it already has strength. - Step 3: Set Peer Benchmarked Targets
Compare those components with direct competitors in the same industry. If asset turnover is lower than the market average, for example, management may need to focus on asset utilization instead of cutting costs across the board. - Step 4: Execute Capital Allocation Adjustments
Use those findings to guide action. That could mean improving margins through pricing, selling underused assets, or adjusting the capital structure in a more disciplined way to support growth.
Conclusion
Return on equity is one of the most useful metrics for understanding how efficiently a company turns shareholders’ equity into profit. It helps you look beyond surface level revenue figures and assess whether a business is creating value through strong profitability, efficient asset use, and disciplined capital management.
Still, ROE should not be treated as a standalone answer. A high figure can reflect healthy business performance, but it can also be influenced by debt, share buybacks, accounting adjustments, or industry differences. That is why ROE becomes far more meaningful when you read it alongside DuPont Analysis, ROA, historical trends, and the wider financial context behind the number.
If you want to evaluate profitability and financial performance with better accuracy, using the right accounting system can make that process much easier. To see how a more connected system can support reporting, analysis, and day to day decision making, you can explore HashMicro through a free demo by clicking the banner below.
Frequently Asked Questions About Return on Equity
-
What is considered a good return on equity?
There is no single ROE benchmark that applies to every company. A strong result depends on the industry, the company’s capital needs, and its historical performance. That is why ROE is usually more useful when you compare it with industry peers and the company’s own past results, rather than reading the number in isolation.
-
Can return on equity be negative?
Yes. ROE can turn negative when a company reports a net loss or when shareholders’ equity becomes negative. In that situation, the ratio becomes less useful as a performance indicator and needs to be reviewed together with the company’s broader financial condition.
-
Why should ROE be compared with ROA?
Comparing ROE with ROA helps you see whether strong returns are coming from efficient operations or from higher financial leverage. If ROE is much higher than ROA, debt may be playing a major role in lifting the result. That comparison gives a more complete view of profitability and balance sheet risk.
-
Can a high ROE be misleading?
Yes. A high ROE does not always mean a company is fundamentally strong. The number can also be pushed up by share buybacks, lower equity balances, or heavy borrowing. That is why ROE should always be read together with leverage, capital structure, and other performance measures.