


The acid-test ratio is a key indicator of immediate financial stability. It determines if a company can meet short-term obligations without selling long-term assets or risking bankruptcy. For leaders and investors, it remains one of the most rigorous ways to verify a business’s ability to survive sudden financial stress.
Often referred to as the quick ratio, this metric strips away the less liquid components of a company’s current assets, providing a crystal-clear picture of what would happen if all short-term liabilities suddenly came due. Unlike broader metrics that might paint an overly optimistic picture by including inventory that could take months to sell, this specific calculation focuses entirely on assets that can be converted to cash almost instantly.
Real-world data proves this point as highlighted in a 2025 financial analysis of Malaysian retail giant Bonia Corporation, a 12% deterioration in their quick ratio (dropping from 2.16 to 1.90) immediately raised red flags regarding the firm’s short-term financial flexibility, despite their broader market expansion. immediately raised red flags regarding the firm’s short-term financial flexibility, despite their broader market expansion.
Key Takeaways
|

Understanding the Concept of the Acid Test Ratio

The term acid test comes from the historical practice of using nitric acid to verify genuine gold. In finance, this ratio applies a similarly rigorous standard by testing if a company can meet all its current liabilities immediately without relying on inventory sales. It serves as a stress test to determine the organization’s true, immediate liquidity.
At its core, this metric is a severe test of short-term financial viability. It measure
s the proportion of highly liquid assets—such as cash, cash equivalents, marketable securities, and easily collectible accounts receivable—against current liabilities. Current liabilities typically include accounts payable, short-term debt, accrued expenses, and other obligations due within one year or one operating cycle. By excluding inventory and prepaid expenses, which cannot be reliably or rapidly converted into cash at their book value, the metric provides a conservative assessment of a company’s financial defense mechanisms.
Analysts favor this metric because it bypasses potentially obsolete or overvalued inventory. While large stock levels can make a company look sound on paper, they provide no protection if they cannot be sold quickly to pay creditors. By stripping away these illiquid assets, the ratio reveals the true cash and liquid reserves available to meet immediate debts.
The Role of Liquidity in Corporate Survival
Liquidity is the lifeblood of any commercial enterprise. A company can be highly profitable on its income statement but still face bankruptcy if it lacks the cash to pay its immediate bills. Profitability indicates that a company is generating more revenue than expenses over time, but liquidity dictates whether it can survive the timeline required to realize those profits.
When creditors evaluate a business for a short-term loan, or when suppliers decide whether to extend trade credit, they look closely at immediate payment capacity. The acid test ratio provides these external stakeholders with a reliable gauge of risk. A strong metric reassures suppliers that their invoices will be paid on time and gives lenders confidence that short-term debt obligations will be met without friction.
Furthermore, from an internal management perspective, maintaining an optimal balance of liquid assets is crucial for operational agility. Companies with strong immediate cash availability can seize unexpected market opportunities, negotiate better terms with suppliers by offering upfront payments, and navigate macroeconomic downturns without resorting to distressed asset sales or emergency borrowing at exorbitant interest rates.
The Formula and Calculation Methods
Calculating this critical metric requires a clear understanding of a company’s balance sheet. There are two primary ways to compute the ratio, both of which yield the same result provided the balance sheet is properly categorized. The choice of formula usually depends on how the financial data is presented.
Method 1: The Subtraction Approach
The first and most common method involves taking the total current assets and sub
tracting the less liquid components. The formula is structured as follows:
Acid Test Ratio = (Total Current Assets – Inventory – Prepaid Expenses) / Current Liabilities
This approach is often preferred when looking at a summarized balance sheet. Current assets encompass all assets expected to be converted to cash within a year. By explicitly subtracting inventory (which takes time to sell) and prepaid expenses (which represent future economic benefits rather than realizable cash), you are left with the quick assets.
Method 2: The Addition Approach
The second method involves adding together only the most liquid assets. The formula is:
(Cash + Cash Equivalents + Marketable Securities + Current Accounts Receivable) / Current Liabilities
This granular approach ensures that only specifically identified liquid assets are included in the numerator. Let us break down these components to understand their precise definitions within the context of corporate accounting:
- Cash and Cash Equivalents: This includes physical currency, bank account balances, treasury bills, and short-term government bonds with a maturity of 90 days or less. These are assets that are already cash or can be converted to cash instantly with negligible risk of value loss.
- Marketable Securities: These are highly liquid financial instruments that can be quickly sold on public exchanges. Examples include publicly traded stocks and corporate bonds. To qualify for the numerator in this calculation, these securities must be easily convertible to known amounts of cash.
- Current Accounts Receivable: This represents money owed to the company by its customers for goods or services already delivered. It is crucial that only current and collectible receivables are included. Allowances for doubtful accounts must be deducted, as uncollectible debts do not provide liquidity.
- Current Liabilities: The denominator encompasses all financial obligations due within the next 12 months. This includes accounts payable, short-term loans, the current portion of long-term debt, accrued taxes, and accrued payroll.
Regardless of the calculation method used, the underlying principle remains roo
ted in the fundamental balance-sheet formula, ensuring that the relationship between assets, liabilities, and equity is accurately reflected in the company’s immediate financial posture.
Acid Test Ratio vs. Current Ratio: A Critical Distinction

To fully appreciate the value of the acid test ratio, it must be contrasted with its more lenient counterpart: the current ratio. While both are categorized as liquidity ratios, they serve different analytical purposes and provide distinct perspectives on a company’s financial stability.
The current ratio is calculated
by dividing total current assets by total current liabilities. It includes everything in the current asset category, most notably inventory and prepaid expenses. For a manufacturing or retail company, inventory often represents the largest single component of current assets. Therefore, the current ratio assumes that a company can and will sell its inventory quickly enough to pay off its short-term debts.
However, this assumption is frequently flawed in real-world scenarios. Inventory is inherently risky. A sudden change in consumer trends, a technological disruption, or an economic recession can render inventory unsellable, or force a company to sell it at a steep discount (markdowns). If a company is forced to liquidate inventory in a crisis, it rarely recovers the book value recorded on the balance sheet.
When to Use Which Metric
Analysts rarely use a single metric in isolation, as the gap between the current and acid-test ratios reveals a company’s operational structure. A wide gap—such as a 2.5 current ratio versus a 0.6 acid-test ratio—indicates a heavy reliance on inventory, which is common for machinery dealers but a major red flag for software firms.
Conversely, nearly identical ratios suggest minimal inventory, a hallmark of service-based businesses, consulting firms, and digital developers. Comparing these metrics ensures liquidity assessments align with the specific realities of the industry.
Step-by-Step Calculation Examples
To solidify the concept, let us walk through comprehensive, real-world calculation scenarios involving two hypothetical companies operating in different sectors.
Scenario 1: TechNova Solutions (A Software Company)
TechNova Solutions provides enterprise software services. At the end of the fiscal quarter, their balance sheet shows the following figures:
- Cash and Equivalents: $450,000
- Marketable Securities: $150,000
- Accounts Receivable: $300,000
- Inventory: $10,000 (promotional merchandise)
- Prepaid Expenses: $40,000
- Total Current Assets: $950,000
- Accounts Payable: $120,000
- Short-term Debt: $80,000
- Accrued Liabilities: $100,000
- Total Current Liabilities: $300,000
Using the addition method to calculate the acid test ratio:
Quick Assets = Cash ($450,000) + Marketable Securities ($150,000) + Accounts Receivable ($300,000) = $900,000
Acid Test Ratio = $900,000 / $300,000 = 3.0
Interpretation: TechNova Solutions has a highly liquid position. For every dollar of current liabilities, the company has $3.00 in easily accessible liquid assets. This is exceptionally strong and indicates minimal short-term financial risk.
Scenario 2: Global Retail Enterprises (A Department Store Chain)
Global Retail Enterprises operates a chain of large physical stores. Their balance sheet at the end of the fiscal year reveals:
- Cash and Equivalents: $200,000
- Marketable Securities: $50,000
- Accounts Receivable: $150,000
- Inventory: $1,400,000
- Prepaid Expenses: $100,000
- Total Current Assets: $1,900,000
- Accounts Payable: $600,000
- Short-term Loans: $300,000
- Accrued Payroll and Taxes: $100,000
- Total Current Liabilities: $1,000,000
First, let’s look at their Current Ratio for context: $1,900,000 / $1,000,000 = 1.9. On the surface, the company looks healthy, with nearly twice as many current assets as liabilities.
Now, let’s calculate the acid test ratio using the subtraction method:
Quick Assets = Total Current Assets ($1,900,000) – Inventory ($1,400,000) – Prepaid Expenses ($100,000) = $400,000
Acid Test Ratio = $400,000 / $1,000,000 = 0.4
Interpretation: The situation changes dramatically. Without relying on inventory sales, Global Retail Enterprises only has 40 cents of liquid assets for every dollar of short-term debt. If a crisis occurred and sales halted, they would struggle immensely to pay their suppliers and creditors. This highlights why evaluating this specific calculation in financial is vital for uncovering hidden vulnerabilities in inventory-heavy businesses.
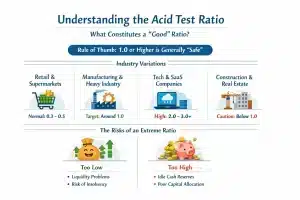
What Constitutes a Good Acid Test Ratio?
The definition of a healthy ratio is highly dependent on the industry, the company’s business model, and the macroeconomic environment. Consequently, determining an acceptable acid-test ratio is less about reaching a universal 1.0 and more about ensuring the metric aligns with the specific liquidity demands and operational pace of the business.
However, in modern corporate finance, applying a blanket standard of 1.0 to all businesses is overly simplistic and often misleading. The definition of a healthy ratio is highly dependent on the industry, the company’s business model, and the macroeconomic environment.
Industry-Specific Variations
Different sectors have vastly different operating cycles, which naturally dictate their baseline liquidity requirements. Understanding these nuances is key to accurate financial analysis.
1. Retail and Supermarkets
In the retail and FMCG sectors, an acid-test ratio between 0.3 and 0.5 is normal and not a sign of distress. These businesses turn inventory into cash so fast that they often collect customer payments before their own supplier bills are due. Because of this rapid turnover, they do not need to hold large stockpiles of cash to stay solvent.
2. Manufacturing and Heavy Industry
Manufacturing companies generally aim for a ratio closer to 1.0. The manufacturing process involves significant lead times—purchasing raw materials, converting them to work-in-progress, finishing the goods, and finally selling them. Because their capital is tied up in inventory for extended periods, they need a stronger buffer of cash and receivables to cover operating expenses and short-term debt during the production cycle.
3. Technology and Software as a Service (SaaS)
Tech and SaaS companies typically maintain high acid-test ratios, often exceeding 2.0 or 3.0. Because these businesses carry almost no physical inventory, their current assets consist primarily of cash and accounts receivable. A ratio below 1.0 is rare in this sector and often signals a dangerously high cash burn rate or difficulty in collecting subscription revenue.
4. Construction and Real Estate
The construction industry often struggles with liquidity due to the nature of project-based billing. Payments from clients (receivables) can be delayed, while subcontractors and material suppliers (payables) receive immediate payments.Construction firms must carefully manage their cash flows, and a ratio below 1.0 can quickly lead to project delays or insolvency if a major client defaults on a payment.
The Dangers of a Ratio That is Too High
While a low ratio signals liquidity risk, an excessively high one—such as 4.0 or 5.0—often indicates inefficient capital allocation. Holding surplus cash or high receivables means capital is sitting idle and losing value to inflation over time.
Instead of hoarding liquidity, proactive management should reinvest those funds into R&D, market expansion, or shareholder returns. Ultimately, an outlier ratio can suggest a lack of strategic growth or an overly conservative financial stance rather than true fiscal strength.
Factors Influencing Your Company’s Acid Test Ratio
A company’s liquidity position is not static; it fluctuates continuously based on daily operational activities, management decisions, and external market forces. Several key factors directly influence the numerator and denominator of the calculation.
1. Accounts Receivable Turnover
The speed at which a company collects payments from its customers dramatically affects its liquid assets. If a business offers highly lenient credit terms (e.g., Net 90 days) and has a poor collection department, its accounts receivable balance will swell. While this keeps the acid test ratio mathematically high, it represents trapped liquidity. If those receivables age into bad debts, they must be written off, causing a sudden and sharp drop in the ratio.
2. Accounts Payable Management
Managing supplier payments directly impacts both liquid cash and current liabilities. Paying invoices immediately reduces cash reserves, which lowers the acid-test ratio. By negotiating longer payment terms, such as moving from Net 30 to Net 60, businesses can keep cash on hand longer to maintain a stronger liquidity position. This strategy helps optimize the cash conversion cycle, provided the company avoids late fees and maintains good supplier relationships.
3. Inventory Management Systems
Poor inventory management can indirectly damage your acid-test ratio. Over-purchasing stock drains cash reserves to pay for goods that sit idle, which reduces the liquid assets available in your calculation. Implementing Just-In-Time (JIT) inventory systems helps minimize the cash tied up in physical products, allowing you to maintain higher levels of true liquidity for other business needs.
4. Debt Structure and Refinancing
Debt classification significantly impacts the acid-test ratio through the timing of obligations. Large loans due within a year categorize as current liabilities, lowering your liquidity score. Refinancing this debt into long-term obligations removes the liability from the short-term calculation. This restructuring instantly improves your liquidity metrics without needing extra cash flow.
Strategic Ways to Improve the Acid Test Ratio
When financial analysis reveals a dangerously low liquidity position, executive management must take decisive action to fortify the balance sheet. Improving this metric requires a multi-pronged approach targeting both assets and liabilities.
Accelerating Cash Inflows
- Invoice Factoring and Discounting: Companies can sell their outstanding accounts receivable to a third-party financial institution (a factor) at a slight discount. This instantly converts receivables into cash, improving the immediate quality of the quick assets.
- Offering Early Payment Discounts: To encourage customers to pay faster, businesses can offer terms such as 2/10, Net 30 (a 2% discount if paid within 10 days). While this slightly reduces profit margins, the accelerated cash flow bolsters immediate liquidity.
- Tightening Credit Policies: Conducting stricter credit checks on new customers and refusing to extend credit to clients with a history of late payments prevents the buildup of risky, uncollectible receivables.
Managing Cash Outflows and Liabilities
- Renegotiating Supplier Terms: Extending accounts payable terms from 30 days to 45 or 60 days keeps cash in the company’s accounts for a longer period, providing a temporary boost to liquidity metrics.
- Converting Short-Term Debt to Long-Term Debt: As mentioned previously, refinancing short-term obligations into long-term loans removes them from the denominator of the equation, instantly improving the ratio.
- Delaying Non-Essential Capital Expenditures: Postponing the purchase of new equipment, office renovations, or vehicle fleets preserves cash reserves during periods of tight liquidity.
Liquidating Idle Assets
- Selling Unused Equipment: Disposing of machinery, vehicles, or real estate that are no longer essential to core operations generates immediate cash injections.
- Aggressive Inventory Clearance: While inventory isn’t part of the quick assets, selling obsolete or slow-moving stock at a discount converts a non-liquid asset into cash, directly increasing the numerator of the acid test ratio.
Limitations and Blind Spots of the Metric
Despite its rigor and widespread use, the acid test ratio is not a flawless indicator. Relying on it exclusively without understanding its inherent limitations can lead to dangerous miscalculations regarding a company’s true financial health.
The Timing of Cash Flows
The most significant limitation of any balance sheet ratio is that it represents a snapshot in time. The balance sheet shows the financial position at the exact close of business on a specific date (e.g., December 31st). It does not account for the timing of cash flows.
The formula assumes that all accounts receivable are perfectly liquid and will be collected in full. In reality, during economic downturns, a company’s customers may default on their payments. If a large portion of the receivables included in the quick assets turns out to be uncollectible bad debt, the ratio provides a false sense of security.
Window Dressing
Management may use window dressing legal but tactical accounting maneuvers—to artificially boost ratios before reporting periods. Examples include delaying inventory purchases to preserve cash or aggressively collecting receivables just before the quarter ends. While these actions temporarily inflate the acid-test ratio to satisfy analysts, they do not reflect the business’s sustainable, day-to-day liquidity.
Ignoring Off-Balance-Sheet Obligations
The calculation only considers liabilities explicitly recorded on the balance sheet. It ignores off-balance-sheet items, contingent liabilities, or upcoming operational commitments (like an impending lawsuit settlement or non-cancelable purchase orders) that could severely drain cash reserves in the near future.
Advanced Liquidity Analysis: Beyond the Acid Test
Because of these limitations, sophisticated financial analysts use the acid test ratio as just one piece of a larger puzzle. To gain a comprehensive understanding of liquidity, it must be evaluated alongside other critical metrics.
The Cash Ratio
For an even more conservative view, analysts use the Cash Ratio. This metric excludes accounts receivable entirely, calculating liquidity strictly as: (Cash + Cash Equivalents) / Current Liabilities. This is the ultimate stress test, assessing whether a company can survive if its customers completely stop paying their bills.
Operating Cash Flow Ratio
While balance sheet ratios are static, the Operating Cash Flow Ratio is dynamic. It assesses how well the actual cash generated from core business operations covers current liabilities over a period (usually a year). The formula is: Operating Cash Flow / Current Liabilities. This metric bypasses the timing issues of the balance sheet and reveals whether the company’s daily operations are actually generating enough cash to sustain its debts.
Working Capital Analysis
Analyzing the total net working capital (Current Assets – Current Liabilities) provides context to the ratios. A company might have a low acid test ratio but a massive, highly stable line of credit with a major bank. In such a case, the mathematical ratio matters less because the company has guaranteed access to external liquidity on demand.
Industry-Specific Use Cases for the Acid Test Ratio
Retail and E-commerce
In the retail and e-commerce sectors, inventory represents a massive portion of total assets. Because consumer trends shift rapidly and seasonal goods can quickly become dead stock, relying on inventory to cover short-term debts is highly risky.
For these businesses, the acid test ratio is a vital reality check. A clothing retailer might boast a healthy current ratio, but a quick ratio below 0.5 indicates dangerous over-leverage on unsold merchandise and a potential cash crunch if supplier invoices come due before the inventory clears.
Manufacturing Sector
Manufacturing companies deal with complex inventory stages: raw materials, work-in-progress (WIP), and finished goods. Raw materials and WIP are notoriously difficult to liquidate quickly at book value. Therefore, manufacturers use the acid test ratio to strip away these illiquid assets and focus strictly on their cash reserves and outstanding invoices from distributors. Heavy manufacturers often operate with slightly lower quick ratios due to capital-intensive operations, but sudden dips in this metric often trigger immediate cost-cutting measures or the renegotiation of short-term credit lines.
Software and Service Industries
Conversely, Software as a Service (SaaS) and professional consulting firms carry little to no physical inventory. For these organizations, the current ratio and the acid test ratio are nearly identical.
Implementation Steps for Routine Monitoring
To transition this metric from a theoretical accounting concept to an actionable management tool, organizations must implement systemic processes for routine monitoring. Here are the practical steps to integrate this metric into daily financial operations:
- Automate Balance Sheet Data Extraction: Utilize modern Enterprise Resource Planning (ERP) systems to automatically pull real-time data on cash equivalents, marketable securities, and current liabilities. This eliminates manual calculation errors and provides a live view of financial health.
- Strictly Categorize Receivables: Ensure your accounting software clearly separates short-term, highly collectible accounts receivable from long-term or doubtful accounts. Only invoices expected to be paid within 90 days should be factored into the quick asset calculation.
- Establish Dashboard Alerts: Configure financial dashboards to trigger automated alerts if the ratio drops below a pre-determined threshold (e.g., 0.8). This allows CFOs and treasury managers to proactively secure bridge loans or accelerate collections before a crisis materializes.
- Conduct Rolling Weekly Forecasts: Incorporate the metric into weekly cash flow forecasting. By projecting how upcoming payroll and vendor payments will impact the ratio over the next 13 weeks, leadership can make informed decisions regarding capital expenditures.
Advanced Practices for Strategic Financial Management
For organizations looking to move beyond basic compliance and reporting, advanced applications of the acid test ratio can drive strategic business decisions, optimize capital structures, and enhance competitive advantages.
Stress Testing and Scenario Analysis
Modern finance teams use the acid-test ratio for corporate stress testing and scenario planning. By simulating events like sales drops, collection delays, or credit freezes, companies can predict how their liquidity will hold up under pressure. This proactive modeling helps organizations determine the exact cash buffer required to survive worst-case scenarios without defaulting on their obligations.
Integration with the Cash Conversion Cycle (CCC)
Evaluating the acid-test ratio in isolation limits its usefulness. Financial leaders often cross-analyze it with the Cash Conversion Cycle (CCC), which measures how quickly a company turns resources into cash. A business with a low quick ratio can still operate safely if it has a fast CCC, collecting cash from customers before supplier bills are due. Conversely, a high quick ratio may be necessary to offset a sluggish CCC and ensure the company remains solvent.
Dynamic Competitor Benchmarking
Leading firms use dynamic benchmarking to track competitor acid-test ratios rather than relying on static industry averages. This continuous monitoring helps identify whether a company’s liquidity is truly efficient or if capital is sitting idle. While a high ratio ensures safety, it can also signal missed opportunities for R&D, reinvestment, or dividends. Sophisticated financial leaders balance the need for liquidity against the potential growth lost by holding excess cash.

Conclusion
The acid-test ratio stands as a rigorous indicator of a company’s immediate financial stability. By explicitly excluding less liquid assets like inventory, this metric reveals whether a business can survive sudden financial stress without selling off critical long-term assets. It provides a much clearer picture of short-term risk compared to broader calculations like the current ratio.
While a ratio of 1.0 is traditionally considered the standard for financial safety, the ideal number varies dramatically across different business sectors. Industries with rapid inventory turnover, such as retail, can safely operate with much lower ratios. Conversely, service-based and technology companies typically maintain higher numbers because they lack physical stock.
To maximize the value of your financial data, move from static quarterly reports to automated, real-time monitoring. Modern ERP systems enable proactive scenario planning and rapid adjustments to credit policies, helping you balance immediate safety with long-term strategic growth. To see how real-time tracking can streamline your financial oversight, you can book a free demo of our integrated management tools.

FAQ About Acid-test ratio
-
How can a company quickly improve a poor acid-test ratio?
A company can quickly improve a poor acid-test ratio by accelerating cash inflows, such as utilizing invoice factoring or offering early payment discounts (e.g., 2/10 Net 30) to convert accounts receivable into cash instantly. Additionally, management can renegotiate liabilities by extending accounts payable terms with suppliers to keep cash in the business longer, or restructure debt by refinancing short-term obligations into long-term loans to remove them from the current liabilities calculation.
-
What are the hidden blind spots of this metric?
This metric has several hidden blind spots, primarily regarding the timing of cash flows. Because it is only a snapshot in time, a healthy ratio on December 31st does not guarantee survival if a massive bill is due on January 2nd before receivables are collected. Furthermore, management can engage in window dressing to artificially inflate the ratio before reporting periods by delaying inventory purchases or aggressively collecting debts. Lastly, the formula assumes all accounts receivable will be paid in full, ignoring the reality that some clients might default during an economic downturn.
-
Why do SaaS companies and retail stores have vastly different ideal ratios?
These industries have vastly different ideal ratios due to the nature of their physical assets. Retailers and fast-moving consumer goods (FMCG) stores turn inventory into cash extremely fast, meaning they can safely operate with a much lower quick ratio, typically around 0.3 to 0.5. In contrast, SaaS and software companies carry almost zero physical inventory. Because of this, their quick ratio and current ratio are virtually identical, and they are generally expected to maintain a metric of 2.0 or higher.