


Many businesses only realize they have an inventory problem when it starts affecting cash flow or customer orders. Stock may look available in the report, but slow-moving items keep taking up space while fast-moving products suddenly run out.
Data from PwC shows that 73% of customers value experience and 43% are willing to pay more. In practice, this often comes down to product availability. When inventory data is unclear, businesses struggle to keep the right items in stock, which can directly affect customer satisfaction and lost sales.
This is where the average inventory formula becomes useful. It helps businesses understand how much stock they actually hold over time, so purchasing, storage, and cash flow decisions are based on a more reliable inventory baseline.
Key Takeaways
|
Know exactly what’s in stock and prevent costly inventory mistakes.

Understanding the Average Inventory Formula
Average inventory estimates the volume or value of stock held during a designated accounting period. Unlike a point in time measurement which can be skewed by large shipments at month end, this calculation provides a balanced view of year round holdings.
The standard formula is:
Average Inventory = (Beginning Inventory + Ending Inventory) / 2
Here is what each part means:
- Beginning inventory: the stock value or quantity available at the start of the period.
- Ending inventory: the stock value or quantity left at the end of the period.
- Divided by 2: used because the formula calculates the average between two inventory points.
For example, if a business starts the month with $20,000 in inventory and ends with $30,000, the average inventory is:
($20,000 + $30,000) / 2 = $25,000
This means the business held an average of $25,000 in inventory during that period.
The formula is useful for small and medium-sized businesses because it is simple and quick to calculate. However, it may not fully reflect inventory changes when stock levels move sharply during the month, such as during seasonal demand, bulk purchases, or sudden stockouts. In that case, businesses may need to use more frequent inventory records to get a more accurate average.
Financial vs. Physical Inventory Averaging
When using the average inventory formula, businesses can measure inventory in two ways: by physical units or by financial value. Both are useful, but they serve different purposes in inventory management.
- Physical average inventory: focuses on the number of items, pallets, or SKUs stored in a warehouse. For example, a warehouse may hold an average of 5,000 units of finished goods during a month. This helps warehouse and supply chain teams plan storage space, labor, and daily operations more effectively.
- Financial average inventory: on the other hand, looks at the monetary value of stock. For example, the same 5,000 units may represent $80,000 in inventory value. This helps finance teams understand how much capital is tied up in stock and calculate metrics such as inventory turnover, working capital, and return on investment.
Businesses should track both because a high physical inventory does not always mean a high financial value, and a small quantity of expensive items can still tie up significant capital. By comparing both views, companies can make better decisions about purchasing, warehouse capacity, and cash flow.
Why Calculating Average Inventory is Crucial for Businesses
Calculating average inventory gives a more realistic view of how inventory behaves over time, especially when stock levels fluctuate within a period.
1. Avoids misleading stock conclusions
Looking only at beginning or ending inventory can distort reality. A business might appear efficient at month-end, even though it held excess stock for most of the period.
2. Reveals hidden inventory costs
Higher average inventory often means higher storage, handling, and insurance costs. It also increases the risk of damage, obsolescence, or expired goods—especially in fast-moving industries.
3. Improves cash flow visibility
Inventory ties up working capital. By tracking the average, businesses can see how much money is consistently locked in stock and whether it could be allocated more effectively elsewhere.
4. Supports better purchasing decisions
Instead of reacting to end-of-period stock levels, teams can use average inventory to plan more stable and accurate replenishment, avoiding overbuying or frequent emergency orders.
5. Strengthens inventory turnover analysis
Average inventory is a key input for calculating inventory turnover. This helps businesses evaluate how efficiently they convert stock into sales and identify slow-moving items.
6. Balances stock levels across operations
With a clearer baseline, companies can better align supply with demand, reducing both overstock and stockout risks during peak and off-peak periods.
7. Improves coordination between finance and operations
Finance teams use it to assess profitability and capital usage, while operations teams use it for planning inventory levels, making it a shared metric across departments.
Step-by-Step Guide to Calculating Average Inventory
While the basic formula is straightforward, implementing it correctly requires careful attention to data collection and accounting periods. Here is a thorough, step by step guide to calculating average inventory for your business.
Step 1: Define the Accounting Period
The first step is determining the timeframe you wish to analyze. The choice of period depends entirely on the business operational cadence and the specific insights management is trying to uncover. Common accounting periods include:
- Monthly: Ideal for fast moving consumer goods (FMCG) and retail businesses that need tight control over short term trends.
- Quarterly: Commonly used for financial reporting, board meetings, and assessing mid term strategic initiatives.
- Annually: Used for year end financial statements, tax reporting, and high level analysis of the business.
Step 2: Determine the Beginning Inventory
The beginning inventory is the value or unit count of the stock on hand at the exact start of your chosen accounting period. In standard accounting practices, the beginning inventory of the current period is always equal to the ending inventory of the immediately preceding period. For example, if you are calculating the average inventory for Q2 (April 1 to June 30), your beginning inventory is the stock balance recorded at the close of business on March 31.
Step 3: Determine the Ending Inventory
The ending inventory is the value or unit count of the stock on hand at the close of the chosen accounting period. Following the Q2 example, this would be the inventory balance recorded at the close of business on June 30. Obtaining accurate ending inventory figures usually requires either a detailed physical stocktake or a reliable perpetual inventory system that tracks every single transaction in real time.
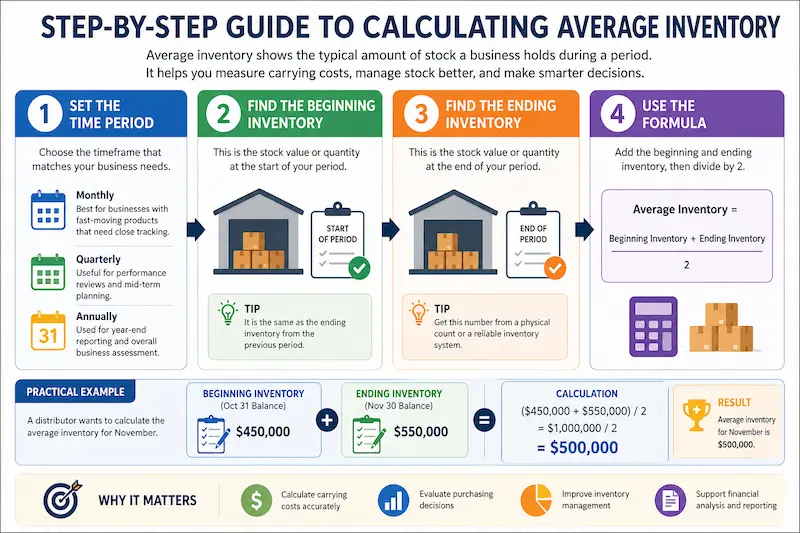
Step 4: Apply the Formula
Once you have both figures, simply add them together and divide by two. Let us look at a practical example. Suppose a mid sized electronics distributor wants to calculate its average inventory for the month of November.
- Beginning Inventory (October 31 balance): $450,000
- Ending Inventory (November 30 balance): $550,000
Calculation: ($450,000 + $550,000) / 2 = $1,000,000 / 2 = $500,000.
The average inventory for November is $500,000. This figure can now be used to calculate monthly carrying costs, assess the efficiency of November purchasing decisions, or feed into broader financial ratios.
Example of Average Inventory
A retail electronics store wants to understand its typical stock holdings to improve long term planning. At the end of the current month, the inventory is valued at $15,000. To gain a more accurate perspective, the management reviews the previous three months where values were recorded at $13,000, $14,500, and $16,000.
To calculate the average inventory over this four month window, the store aggregates all inventory values and divides the total by the number of periods analyzed:
Average Inventory = ($15,000 + $13,000 + $14,500 + $16,000) / 4
The result is an average inventory of $14,625. This calculation provides the business with a stable baseline for managing stock levels and avoiding the risks of overstock or inventory shortages. Utilizing a multi point average like this helps smooth out anomalies that might occur during a single month end report.
How Moving Average Inventory Works
Moving average inventory updates the average cost of stock every time new inventory is purchased. This method is often used in a perpetual inventory system, where stock quantities and values are updated continuously.
- Existing inventory is recorded: The system checks the current quantity and value of stock on hand.
- New stock is added: When a purchase arrives, the system records the new quantity and purchase cost.
- Average cost is recalculated: The total inventory value is divided by the total number of units.
- New inventory value is updated: The updated average cost is used to value the remaining stock.
- COGS becomes more stable: Price changes are spread across inventory, so cost reports do not shift too sharply.
For example, if a business has 100 units at $10 each and buys another 100 units at $14 each, the new moving average cost becomes $12 per unit. This helps businesses track inventory value more fairly when supplier prices change often.

Key Metrics Linked to Average Inventory

Average inventory is not only useful as a standalone number. Businesses often use it in other inventory metrics to measure how fast products sell, how long stock stays in storage, and how much profit inventory generates.
1. Inventory Turnover Ratio
Inventory turnover ratio shows how many times a business sells and replaces its inventory within a specific period. A higher ratio usually means products sell quickly, while a lower ratio may indicate overstocking, slow-moving items, or weak demand.
Formula:
Inventory Turnover Ratio = COGS / Average Inventory
For example, if a retailer has a COGS of $2,000,000 and an average inventory of $500,000, the inventory turnover ratio is: $2,000,000 / $500,000 = 4
This means the retailer sold and replaced its inventory four times during the year.
2. Days Sales of Inventory (DSI)
Days Sales of Inventory, or DSI, shows how many days it takes for a business to sell its inventory. This metric helps companies understand whether stock moves quickly or stays too long in storage.
Formula:
DSI = (Average Inventory / COGS) × 365
Using the same example: ($500,000 / $2,000,000) × 365 = 91.25 days
This means the business takes around 91 days to sell its inventory. A lower DSI is usually better for fast-moving goods, while a higher DSI may still be acceptable for industries with longer sales cycles.
3. Gross Margin Return on Investment (GMROI)
GMROI measures how much gross profit a business earns from every dollar invested in inventory. Retailers often use this metric to identify which products are profitable and which ones tie up too much capital.
Formula:
GMROI = Gross Profit / Average Inventory Cost
For example, if a company earns $1,200,000 in gross profit and has an average inventory cost of $400,000, the GMROI is: $1,200,000 / $400,000 = 3.0
This means every $1 invested in inventory generates $3 in gross profit.
Common Challenges in Measuring Average Inventory
Despite its mathematical simplicity, calculating and interpreting average inventory is fraught with potential pitfalls. Errors in data collection, poor system architecture, and a lack of contextual understanding can lead businesses to make poor strategic decisions based on flawed averages.
Ignoring Severe Seasonality
A basic two point average fails during high volatility. Relying only on start and end of year balances creates a skewed view of cash flow. To achieve the goal of managing seasonal inventory effectively, professionals utilize a 13 point average that captures fluctuations across every month of the year.
Data Inaccuracy and Phantom Inventory
Phantom inventory or stock recorded only in digital systems artificially inflates averages. This error suppresses turnover ratios and leads to wasteful over ordering. Accurate strategic planning requires regular cycle counting and detailed physical audits to ensure data remains pristine.
Excluding Work in Progress (WIP) and In-Transit Stock
Failing to account for all inventory states is a common error in manufacturing and wholesale distribution. Assets include more than finished goods on a warehouse shelf. A true assessment must incorporate raw materials, Work in Progress (WIP) on the production floor, and goods currently in transit from suppliers.
Ignoring these categories leads to a significant underestimation of total inventory investment and working capital needs. A thorough average inventory calculation must aggregate raw materials, WIP, finished goods, and all applicable in transit stock to ensure financial accuracy.
FAQ About Average Inventory Strategy
-
How does the average inventory formula validate a just-in-time strategy?
This formula works as a performance checkpoint for just-in-time operations. If implemented effectively, inventory levels should gradually decline over time without increasing stock shortages. It helps leaders confirm whether working capital is being optimized or if hidden supply risks are emerging.
-
Is a low average inventory always a sign of strong performance?
Not always. While lower inventory often reflects efficiency, it may also indicate limited buffer capacity. Businesses with overly lean stock levels risk missing sales opportunities when demand spikes or supply disruptions occur. The key is balancing efficiency with operational resilience.
-
How should new businesses with zero starting stock apply this calculation?
Startups typically record zero as their initial inventory. Although the formula still applies, early results may appear distorted due to rapid scaling. Using shorter measurement intervals, such as weekly averages during the first quarter, provides a more accurate picture of growth and asset development.
-
Does average inventory influence corporate tax planning?
Yes. Using average inventory provides a more balanced valuation compared to relying on a single reporting date. This approach helps avoid inflated asset values caused by timing fluctuations and supports more accurate financial planning, including tax-related cash flow management.
-
What is the first step if the calculation reveals excess tied-up capital?
The immediate action is to conduct a detailed review of slow-moving inventory. Businesses can then reduce excess stock by clearing obsolete items, renegotiating supplier terms, or adjusting sales strategies to improve turnover and release locked capital.