


In supply chain work, the gap between profit and loss often comes down to one thing that looks simple on paper: inventory availability. If you keep too little stock, you face stockouts, lost sales, and customers who move on faster than you expect.
But if you keep too much, your cash gets stuck in the warehouse, storage costs climb, and you carry a bigger risk of items becoming obsolete. So yes, you are balancing on a thin line: you need enough inventory to serve demand, but not so much that it drains your working capital.
That is exactly where safety stock matters. This is not random extra inventory just in case. It is a data based buffer that helps you absorb the two problems that most often break inventory plans: demand that swings unexpectedly and supplier lead times that do not always behave.
Key Takeaways
|
What Is Safety Stock?

At its core, safety stock is an extra amount of inventory you hold to reduce the chance of running out. It works as a buffer when demand spikes or when supply arrives later than usual. If cycle stock is what you expect to sell based on your forecast, safety stock is what protects you when that forecast is wrong.
You also need to separate safety stock from anticipation inventory. Anticipation inventory is what you build because you already know something is coming, like a seasonal peak, a planned shutdown, or a big promotion. Safety stock is different because it covers what you cannot predict neatly. A sudden surge in orders, shipping delays due to weather, or a supplier disruption are the kinds of situations safety stock is meant to absorb.
From a financial angle, safety stock is a real trade off. Holding more inventory creates costs, from warehousing and insurance to the opportunity cost of tied up cash. But not holding it creates another set of costs that can hurt more over time: stockouts, unhappy customers, and weaker repeat business. So safety stock is not extra stuff. It is the point where the cost of holding inventory meets the cost of losing sales and trust.
Why Safety Stock Matters More Than Most Teams Realize
Many teams treat safety stock like a fixed number that gets set once in an ERP system and then forgotten. That approach ignores how quickly supply chains change. If your parameters stay static while the real world shifts, your safety stock becomes outdated, and you only notice when problems hit.
Mitigating the Bullwhip Effect
The bullwhip effect happens when small changes in retail demand create bigger and bigger swings upstream, from distributors to manufacturers and raw material suppliers. With a reasonable safety stock buffer, you do not have to panic order every time sales jump a little. That keeps your purchasing pattern more stable and helps you avoid pushing chaos into your supplier network.
Protecting Service Levels
Customer patience is low. If an item is not available, many buyers will switch with one click. Safety stock links directly to service level, which is the probability you can meet demand during lead time without a stockout. With a clear policy, you can decide your target, such as 95 percent or 99 percent, and hold inventory based on the risk you are willing to accept.
Buffering Against Lead Time Variability
A lot of inventory planning focuses on demand swings, but lead time variability can quietly cause the worst stockouts. If you import materials or products, shipping schedules, port congestion, or customs clearance can push deliveries back by days. In Malaysia, this risk often increases during high volume periods like Hari Raya or major e commerce campaigns. Safety stock gives you breathing room so your customers do not feel those upstream delays.
Operational Efficiency
Stockouts push your team into constant firefighting. You pay for expedited freight, rush production, and urgent procurement just to keep operations moving. Margins suffer quickly. With the right safety stock, your operation stays closer to plan: production runs more smoothly, shipping stays standard, and your team spends less time reacting to emergencies.
What You Need Before Calculating Safety Stock
Before you touch any formula, you need reliable data. Inventory math follows a simple rule: bad data gives you bad results. If your history is messy, your safety stock will either bloat your warehouse or leave you exposed to frequent stockouts. So you need a solid inventory control setup that captures the variables that matter.
Here are the key data points you should prepare:
- Average Daily Demand: The average number of units you sell or consume per day. Use a long enough period to smooth random spikes, such as the last 6 to 12 months.
- Standard Deviation of Demand: A measure of how much demand varies from the average. Stable items have low deviation. Volatile items have high deviation.
- Average Lead Time: The average time, in days, from placing an order to receiving it. This includes processing, production, and shipping.
- Standard Deviation of Lead Time: A measure of supplier reliability. If a supplier promises 10 days but actually delivers anywhere from 5 to 15, lead time deviation is high.
- Target Service Level: A management decision about the probability of meeting demand from stock. This is usually expressed as a percentage and translated into a Z score.
If you store or process vendor and customer data in your system, keep the compliance side in mind too. In Malaysia, the Personal Data Protection Act 2010 matters when you handle contact details and other personal data. Even in supply chain work, disciplined data access and handling helps you avoid operational and legal headaches.
You also need to clean your data. Remove outliers that do not reflect normal behavior, such as a one time bulk order that is unlikely to repeat. If you let rare events distort your history, your buffer will be based on exceptions, not reality.
How to Calculate Safety Stock
There is no single best safety stock formula for every business. The right method depends on how stable your demand is and how reliable your supply is. Below are common approaches, from simple rules to stronger statistical methods.
Basic Formula Fixed Safety Days
This is the simplest approach. You decide how many days of buffer you want and keep that amount.
Formula:
Safety Stock = Average Daily Usage × Desired Safety Days
It is easy, but it ignores variability. It assumes demand and lead time are constant, which rarely holds in real operations.
Average Max Method
This method is a step up and works well if you do not have advanced statistical tools but still want a buffer that reflects worst case within reason.
Formula:
(Max Daily Usage × Max Lead Time) minus (Average Daily Usage × Average Lead Time)
How it works: you estimate how much you would need if demand hits its peak and supply arrives as late as it ever has. Then you subtract what you would use in a typical situation. The difference is your buffer.
Pros: easy to understand and calculate manually.
Cons: can create high inventory because it assumes peak demand and worst lead time happen together, which is not common.
Standard Deviation Method Z Score Based
This is the most widely used approach in professional planning. It uses demand history to build a buffer that aligns with your target service level.
Formula:
Safety Stock = Z × σD × √L
Where:
Z = Z score for your service level, such as 1.65 for 95 percent
σD = standard deviation of demand
L = average lead time
This version assumes lead time is constant and demand is the main source of uncertainty. It fits well when suppliers are consistent but customer demand changes.
Variable Demand Formula
If your lead time is stable but your customers are unpredictable, you focus on demand variability. In practice, that is the same formula as the standard deviation method above. Your buffer exists to absorb sales spikes.
Variable Lead Time Formula
If demand is stable but suppliers are unreliable, the risk is supply timing, not the market.
Formula:
Safety Stock = Z × D_avg × σL
Where:
Z = Z score
D_avg = average daily demand
σL = standard deviation of lead time
Combined Demand and Lead Time Variability Heizer and Render
In real life, both demand and lead time change. If you only protect against one, you can still end up short. A more robust formula combines both sources of variability.
Formula:
Safety Stock = Z × √((Avg LT × σD²) + (Avg Demand² × σLT²))
This estimates the variability of demand during lead time by combining variances. It is a strong option for complex supply chains because it helps you avoid overstocking while still protecting service levels under dual uncertainty.
Related Formulas You Will Use Alongside Safety Stock
Safety stock is not a standalone number. You use it together with reorder points and order quantities. If you calculate safety stock but do not connect it to ordering logic, you can still run into stockouts or excess inventory.
Reorder Point ROP
Reorder point tells you when to place an order. Without a buffer, you risk stocking out whenever demand or lead time runs higher than expected. Safety stock raises your reorder point to cover that risk.
Formula:
ROP = (Average Daily Usage × Average Lead Time) + Safety Stock
The first part covers expected demand during lead time. The second part adds your buffer.
Economic Order Quantity EOQ
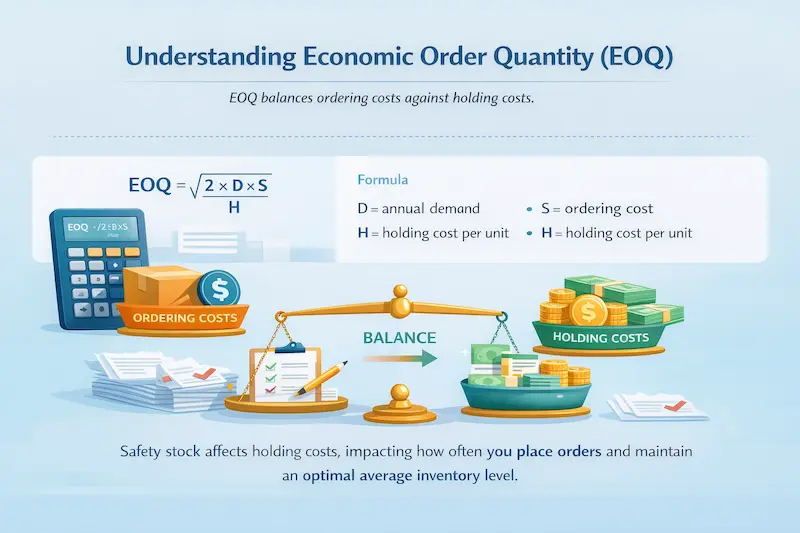
Lead Time Demand
This is the amount of stock you expect to consume while you wait for replenishment to arrive.
Formula:
Average Daily Demand × Average Lead Time
Lead time demand is your forecast. Safety stock is your hedge when reality does not match that forecast. You need both to set a reorder point that holds up in day to day operations.
How to Pick the Right Formula for Your Business
With several formulas available, the best choice depends on your data maturity and risk tolerance. Think of it as matching the tool to your reality, not forcing reality into a single method.
1. The Startup Phase Low Data Low Volume
If you do not have enough clean history, statistical models can give strange results.
Recommendation: use the Average Max Method. It is conservative and easy to run while your data improves.
2. The Steady State Business Stable Supply Variable Demand
If supply is reliable but demand fluctuates, which is common in retail and distribution.
Recommendation: use the Standard Deviation Method focused on demand. You optimize based on customer behavior without over buffering for supply risks that are minor.
3. The Global Importer Stable Demand Volatile Supply
If your demand is stable but lead time is unpredictable, which often happens with overseas sourcing.
Recommendation: use the Variable Lead Time Formula.
4. The High Performance Enterprise High Volatility High Service Requirements
If both demand and supply are volatile and stockouts are costly.
Recommendation: use the Combined Demand and Lead Time Variability formula. It is the most reliable option when you face dual uncertainty.
Safety Stock Calculation Example
To make this practical, here is a step by step example using the standard deviation method that focuses on demand.
Scenario: you sell fast moving electronic components.
Data you have:
- Average daily demand: 50 units
- Average lead time: 10 days
- Target service level: 95 percent, Z score 1.65
- Standard deviation of demand: 12 units
Step 1: Pick the formula
Since lead time is stable, use:
Safety Stock = Z × σD × √L
Step 2: Calculate the square root of lead time
√10 is about 3.16
Step 3: Plug in the numbers
Safety Stock = 1.65 × 12 × 3.16
Step 4: Multiply
1.65 × 12 = 19.8
19.8 × 3.16 = 62.56
Step 5: Round up
You cannot hold 0.56 of a unit, so round up.
Safety stock = 63 units
Reorder point:
Cycle stock during lead time = 50 × 10 = 500 units
ROP = 500 + 63 = 563 units
So when your on hand inventory drops to 563, you place a new order.
When to Recalculate Safety Stock
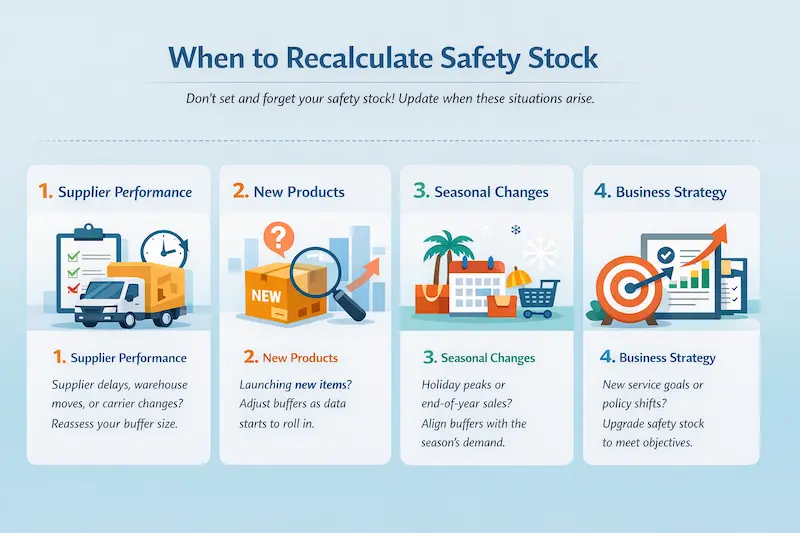
A common mistake is treating safety stock as set and forget. Supply chains keep changing, so your buffer needs updates too. Recalculate when these triggers appear.
1. Changes in Supplier Performance
If a supplier changes warehouses, switches carriers, or faces capacity changes, lead time variability shifts. If reliability improves, you can reduce buffer and free cash. If reliability drops, you need more buffer to maintain the same service level.
2. Introduction of New Products
New products do not have enough history. At first, you can use a simpler method. Once you build a few months of data, switch to a statistical method to tune the buffer more accurately.
3. Seasonal Fluctuations
Demand variability changes with seasons. In Malaysia, spikes can happen before Hari Raya, year end shopping, and major e commerce campaigns. If you rely on a single year round deviation, you can end up overstocked in quiet months and short in peak periods. Segment your calculations by season or relevant periods to keep buffers realistic.
4. Strategic Business Shifts
If leadership raises your service level target from 95 percent to 99 percent, the Z score changes. That means safety stock must increase across affected SKUs. Update immediately so your inventory policy matches the new strategy.

Common Safety Stock Mistakes and How to Avoid Them
Even with the right formulas, implementation mistakes can still ruin your results. Here are the most common issues and how you can prevent them.
1. Applying a One Size Fits All Policy
Using the same service level for every item wastes money. Low value items may justify a lower service target. High margin items usually need a higher target. Segment items using ABC analysis and assign service levels based on impact.
2. Ignoring Lead Time Variability
Many planners focus only on demand. But in global supply chains, lead time variance can be the main driver of stockouts. If suppliers are inconsistent, adding buffer based on demand alone will not fix timing risk. Measure lead time deviation and include it in your calculations.
3. Confusing Safety Stock with Cycle Stock
Some teams see a buffer and assume they do not need to reorder yet. That mistake consumes the buffer during normal operations. Treat safety stock as invisible for routine planning. If you dip into it, treat that as a signal and rebuild the buffer, not a reason to delay replenishment.
4. Relying on Gut Feeling
Manual padding often inflates inventory without solving root causes. Adding a bit more on top of a calculated buffer fills warehouses and strains cash flow. If the result feels too risky, adjust the inputs, such as service level, or improve data quality, instead of arbitrarily increasing the final number.
Conclusion
Safety stock is the financial and operational shock absorber of your supply chain. It bridges the gap between the perfect world of spreadsheets and the chaotic reality of global logistics. By understanding the different calculation methods from the simple Average Max to the comprehensive Heizer & Render formula, you can tailor your inventory strategy to the specific risks your business faces.
However, calculation is only the first step. The real value comes from continuous monitoring and dynamic adjustment. As markets shift, suppliers evolve, and business goals change, your safety stock levels must adapt. While manual spreadsheets can handle basic calculations, modern businesses increasingly rely on automated solutions like HashMicro to process these complex variables in real-time, ensuring that the balance between capital efficiency and customer satisfaction is always maintained.
Mastering safety stock is not just about math; it is about giving your business the resilience to thrive in an unpredictable world.
Frequently Asked Questions About Safety Stock
-
What is safety stock, and how is it different from anticipation inventory?
Safety stock is the buffer you keep for things you can’t predict cleanly, like sudden demand spikes or supplier delays. It’s not extra stock for comfort, it’s there to help you keep fulfilling orders when reality doesn’t match the plan. Anticipation inventory is different because you build it for events you already expect, like seasonal peaks or planned promos.
-
What data do you need before calculating safety stock?
You need clean demand and lead time data: average daily demand, demand standard deviation, average lead time, lead time standard deviation, plus your target service level. You also want to remove outliers that don’t represent normal patterns, so rare one-off events don’t inflate your buffer.
-
Which safety stock formula should you use for your business?
There’s no one size fits all formula. If demand is volatile but lead time is stable, use a method that focuses on demand variability. If demand is stable but suppliers are inconsistent, focus on lead time variability. If both demand and lead time fluctuate, use a combined approach that accounts for both risks.
-
When should you recalculate safety stock?
Don’t treat safety stock as set and forget. Recalculate when supplier performance changes, when you launch new products, when seasonal patterns shift (in Malaysia, spikes often show up before Hari Raya or big e-commerce campaigns), or when your service level target changes. Keeping it updated helps you avoid overstock in quiet periods and stockouts in peak periods.