


Manufacturing teams can lose significant output even when equipment appears to be running. A machine may stay active all shift, but downtime, speed loss, and defects quietly erode usable production.
OEE stands for overall equipment effectiveness. It measures how well planned production time converts into good output, combining availability, performance, and quality into one score.
For Australian manufacturers, OEE identifies production waste before committing to new equipment. This article covers the formula, causes of low OEE, and how software supports more accurate tracking.
Key Takeaways
OEE measures how much planned production time becomes good output by combining availability, performance, and quality.
OEE is calculated by multiplying availability, performance, and quality, with each component identifying a different type of production loss.
Improving OEE means targeting the weakest component first, whether that is downtime, cycle speed, or defect rate.
Manual OEE tracking suits simple operations, but manufacturing software captures data faster and links losses to maintenance and inventory causes.

What is OEE in manufacturing?
OEE in manufacturing measures how effectively equipment converts planned production time into good products. It combines three factors, availability, performance, and quality, into a single percentage score.
In simple terms, OEE answers one question: how much planned production time actually became good output? A score of 100% means equipment ran without interruption, at full speed, with no defects.
A production line with a low OEE score may suffer from breakdowns, slow cycle times, material delays, or rejected products. OEE does not only show that production fell short. It shows which type of loss caused the shortfall.
Two factories can both miss their production targets for entirely different reasons. One may lose output because machines stop frequently. The other may run continuously but produce too many defective units.
Without OEE, both problems look identical in a standard output report. The score identifies which problem is actually present, so teams can focus on the right fix.

Why OEE matters for manufacturing businesses
OEE matters because it turns production losses into measurable categories. Manufacturers can see whether capacity was lost to downtime, slow equipment speed, or quality failures, rather than guessing from output numbers alone.
1. It reveals hidden production capacity losses
Factories often lose capacity in small, difficult-to-notice increments. A few minutes of stoppage, a slower cycle, or a brief changeover delay may not appear serious in isolation.
Across a full shift or a working week, those losses can reduce total output significantly. OEE surfaces these hidden losses by showing whether equipment ran as planned and whether output met the required standard.
This is especially valuable before a business invests in new machines. Existing equipment may still hold unused capacity that better planning and real-time monitoring can recover without capital expenditure.
2. It shows whether losses come from availability, performance, or quality
OEE breaks production losses into three clear categories. Availability shows whether equipment ran during planned production time. Performance shows whether it reached its expected speed. Quality shows whether output met production standards.
This breakdown gives managers something an output report cannot provide: a diagnosis. If availability is weak, the team should investigate downtime patterns and maintenance planning.
If performance is weak, cycle time targets or minor stops are more likely the cause. If quality is weak, the focus should shift to defect rates and rework processes. Without this breakdown, teams risk applying the wrong solution to the wrong problem.
3. It helps managers prioritise improvement actions
OEE helps production managers avoid guessing. Instead of launching broad improvement efforts, they can focus on the largest loss factor first and measure whether results improve over time.
If performance is the weakest component, additional maintenance may not address the actual problem. The better action might be reviewing cycle time targets, machine settings, or changeover procedures on that specific line.
OEE narrows the focus so improvement efforts are tied to actual loss data, rather than general assumptions about what needs fixing. This keeps resources directed where they will have the most impact.
4. It supports better visibility across shifts, lines, and sites
Manufacturers with multiple shifts, lines, or locations need consistent performance data. A single averaged production report can mask wide differences between teams, machines, or facilities.
Tracking OEE by line, shift, product, and site helps managers identify where losses occur most often. It also creates a shared performance language across operations, maintenance, inventory, and quality teams.
For Australian manufacturers running 24-hour production schedules or operating across multiple states, this level of visibility is difficult to achieve without a structured, measurable metric like OEE.
OEE formula: availability x performance x quality
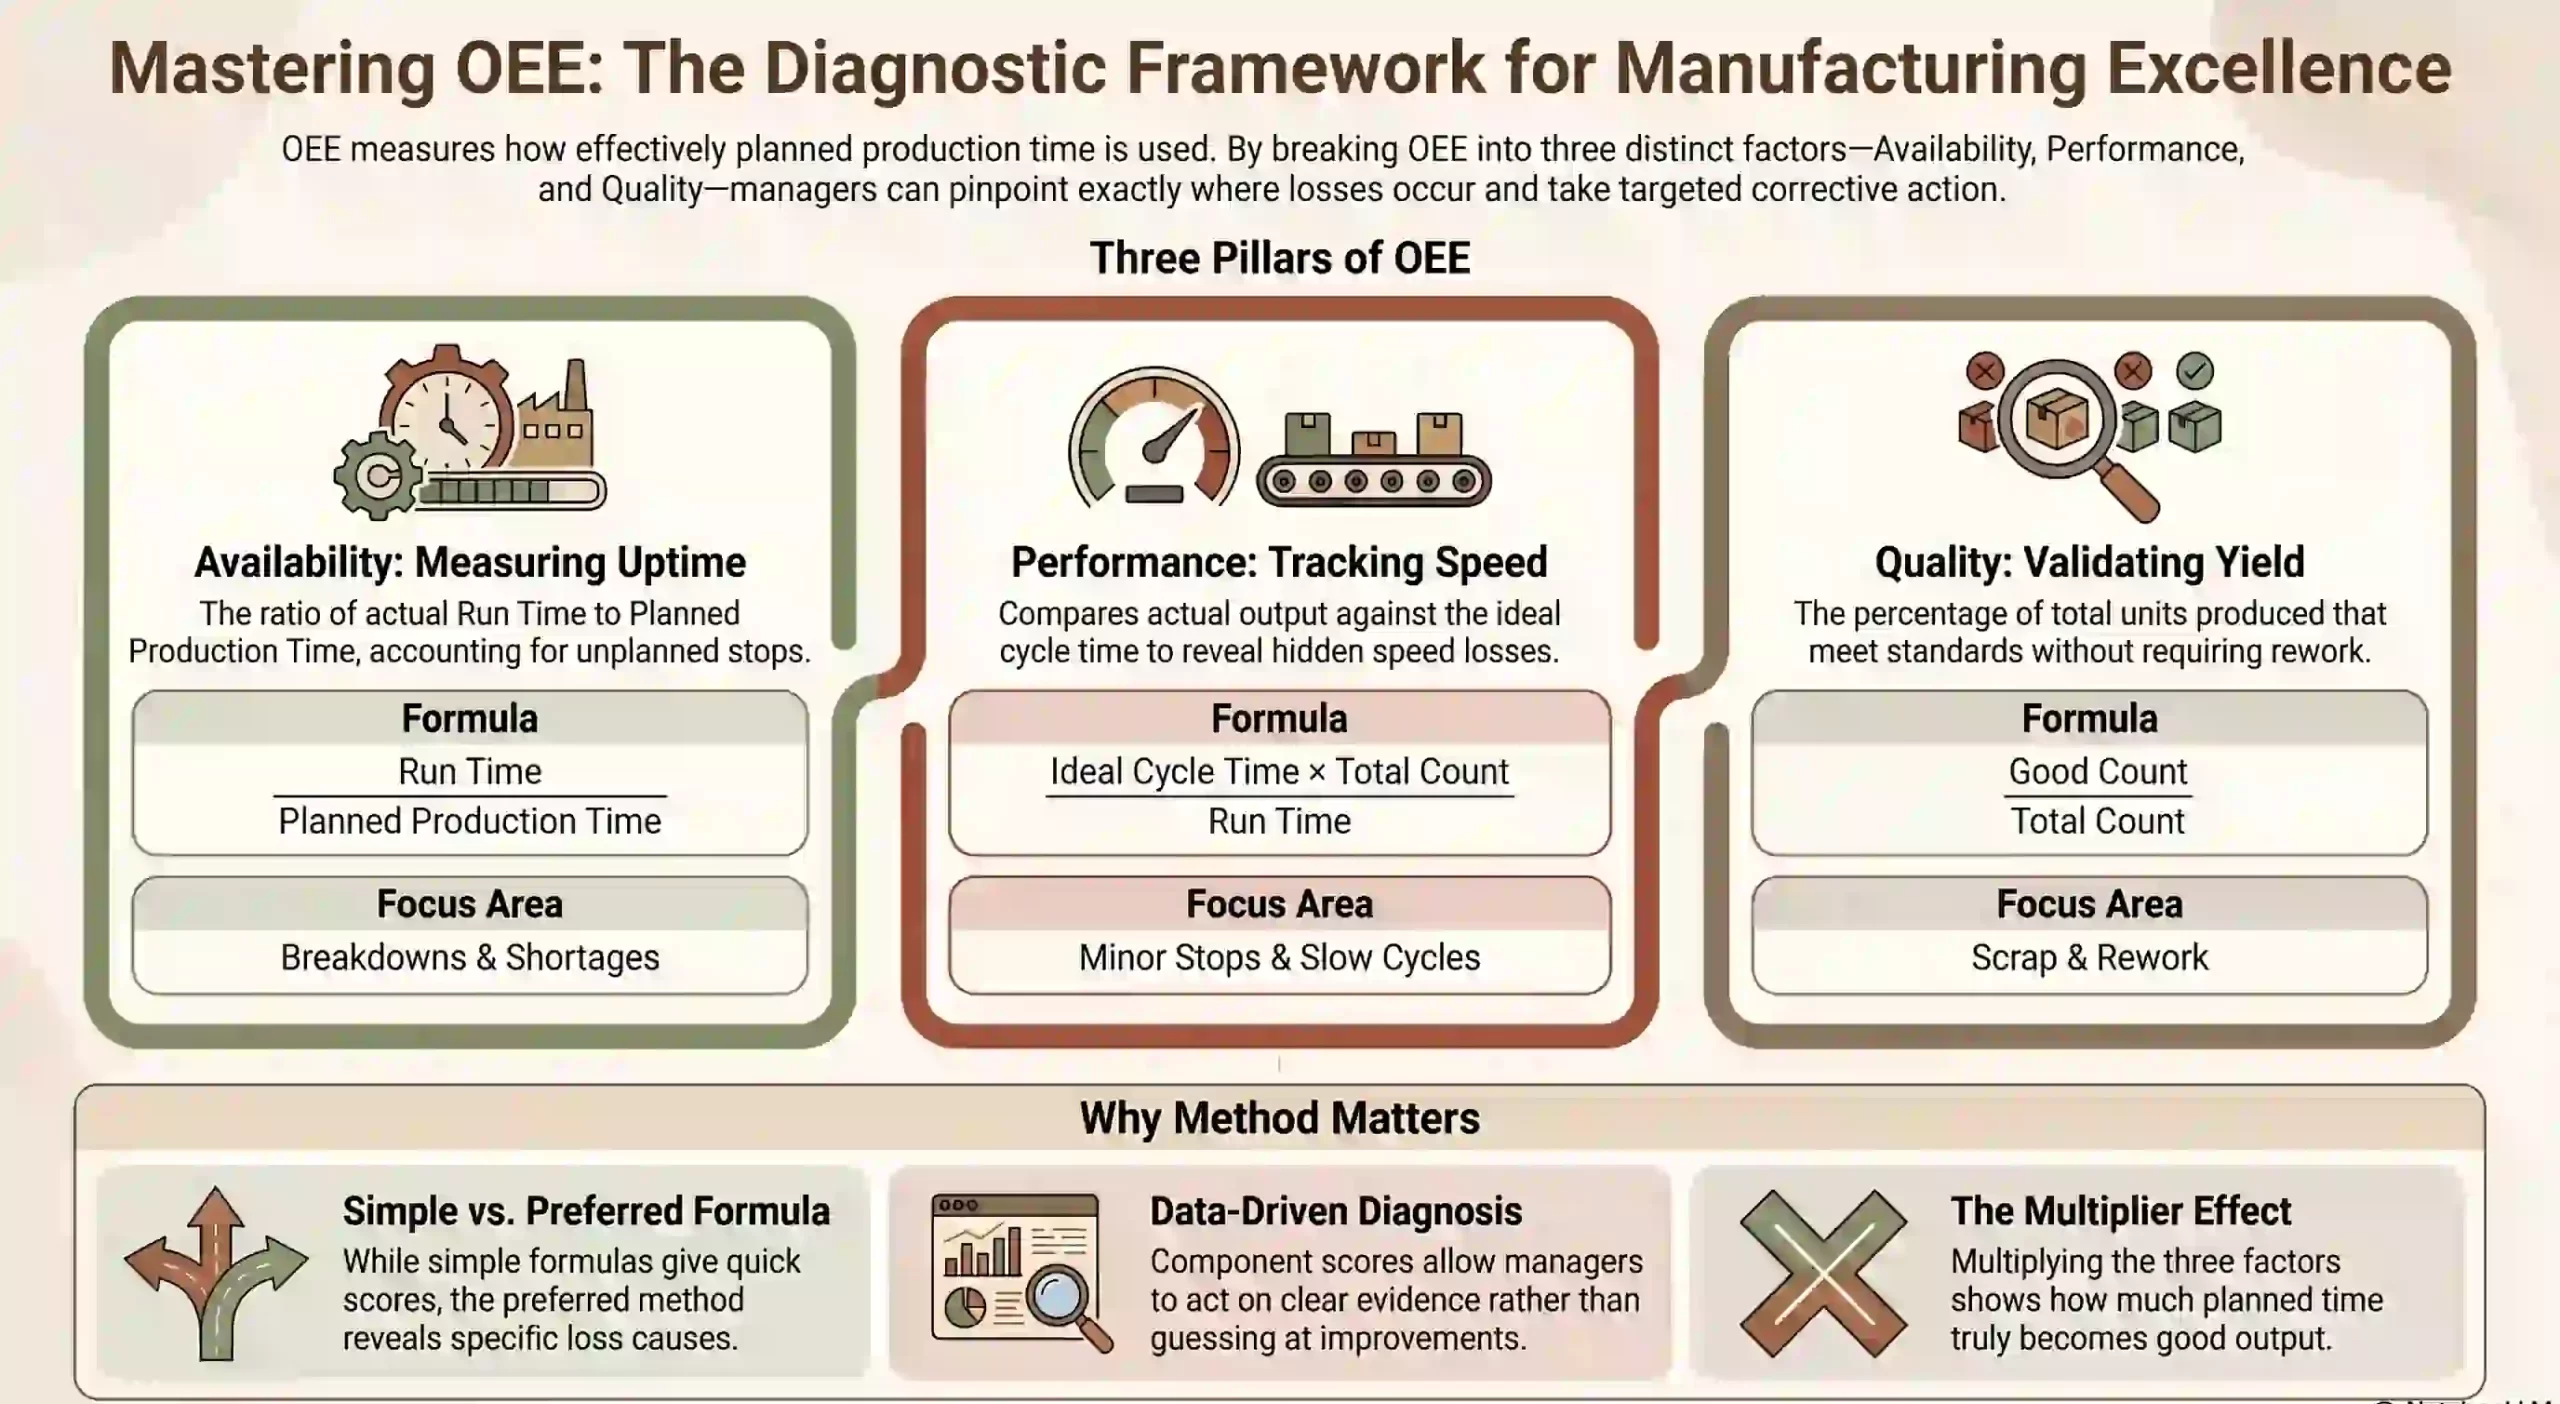
The preferred OEE formula multiplies availability by performance by quality. This method is widely used because it produces both the final OEE score and a diagnostic breakdown of where losses occur.
OEE = Availability × Performance × Quality
1. Availability: how much planned production time is actually used
Availability measures how much of the planned production time the equipment actually runs. Planned production time excludes scheduled breaks and any planned non-production periods.
Availability = Run Time / Planned Production Time
Run time is planned production time minus unplanned stop time. If a line is scheduled for 420 minutes and loses 60 minutes to downtime, run time is 360 minutes, giving an availability of 85.7%.
Availability losses include machine breakdowns, emergency repairs, material shortages that halt the line, and delays related to operator availability or tooling changes. Each of these reduces the time equipment is actually producing.
2. Performance: how close equipment runs to ideal speed
Performance measures whether equipment runs at its expected speed during run time. A machine may be active but still produce fewer units than expected because of minor stops, speed reductions, or process inconsistencies.
Performance = (Ideal Cycle Time x Total Count) / Run Time
Ideal cycle time is the fastest rate the equipment can produce one unit under optimal conditions. When actual output falls below that rate, performance drops below 100%.
Performance losses are among the most commonly underestimated in OEE. Machines appear to be working normally while producing well below their potential output rate.
3. Quality: how much output meets the required standard
Quality measures how much of the total output is accepted as good product and plays an important role in maintaining production standards across manufacturing operations
Quality = Good Count / Total Count
If a line produces 900 units but 45 are defective, only 855 count as good output. Quality losses include scrap, rejected parts, and units that require rework before shipping or use.
Each defective unit represents wasted material, labour, and machine time. Quality losses affect more than output volume. They reduce margin and add pressure to delivery schedules.
4. Complete OEE formula
After calculating each factor separately, multiply the three percentages together. The result shows how much planned production time converted into good output at the expected speed.
OEE = Availability × Performance × Quality
A low final score not only indicates poor overall performance. It also points to the specific factor driving most of the loss, which makes the formula more useful than a single output target.
Managers can use the component scores to act on a clear diagnosis rather than guessing where to start. This is the core advantage of the preferred formula over a simpler single-calculation approach.
5. Simple OEE formula vs preferred OEE formula
Two versions of the OEE formula are commonly used in manufacturing environments.
Simple formula: (Good Count x Ideal Cycle Time)/Planned Production Time
Preferred formula: Availability x Performance x Quality
The simple formula gives a result quickly when detailed production data is limited. However, it does not separate the loss by cause.
The preferred formula is more useful for improvement because it shows whether the loss came from downtime, slow speed, or defects. Teams need this breakdown to take the right corrective action.
How to calculate OEE in manufacturing
To calculate OEE, define planned production time, work out actual run time, record total and good output counts, calculate each factor individually, then multiply them together.
1. Define planned production time
Start with the total scheduled shift time and subtract any planned downtime, including scheduled breaks and planned maintenance periods.
Scheduled shift time: 480 minutes. Planned break: 60 minutes. Planned production time: 420 minutes.
2. Calculate run time
Subtract unplanned stop time from planned production time to find actual run time.
Planned production time: 420 minutes. Unplanned downtime: 60 minutes. Run time: 360 minutes.
3. Identify total count and good count
Record all units produced during the shift, then separate good units from defective or rejected units.
Total units produced: 900. Defective units: 45. Good units: 855.
4. Calculate availability
Divide run time by planned production time.
Availability = 360 / 420 = 85.7%
5. Calculate performance
Multiply the ideal cycle time by the total count, then divide by run time. Assume the ideal cycle time is 0.35 minutes per unit.
Performance = (0.35 x 900) / 360 = 87.5%
6. Calculate quality
Divide the good unit count by the total unit count.
Quality = 855 / 900 = 95%
7. Multiply the three OEE factors
Multiply availability, performance, and quality together to get the final OEE score.
OEE = 85.7% x 87.5% x 95% = 71.2%
The result shows the line is operating at 71.2% of its potential. Availability and performance show the largest improvement opportunities. Even a modest gain in either factor would meaningfully increase the final OEE score.
8. Example OEE calculation table
This is an example of each OEE calculation component to simply demonstrate how to calculate them.
| Component | Calculation | Result |
| Planned production time | 480 – 60 | 420 minutes |
| Run time | 420 – 60 | 360 minutes |
| Availability | 360 / 420 | 85.7% |
| Performance | (0.35 x 900) / 360 | 87.5% |
| Quality | 855 / 900 | 95% |
| Final OEE | 85.7% x 87.5% x 95% | 71.2% |
Common causes of low OEE in manufacturing
Low OEE usually results from losses across availability, performance, or quality. The most common causes include unplanned downtime, slow cycles, changeover delays, material shortages, defects, and delayed reporting.
1. Unplanned equipment downtime
Downtime reduces availability directly. It can occur because of machine breakdowns, emergency repairs, missing spare parts, or insufficient maintenance planning.
When downtime is not tracked by reason, teams may only know the machine stopped without identifying whether the cause was a mechanical failure, an operator delay, or a material shortage.
Accurate downtime records allow maintenance teams to detect patterns. Repeated failures on the same equipment or the same shift point to a root cause that targeted action can resolve.
2. Slow cycles and minor stops
Slow cycles reduce performance without triggering a formal downtime event. A machine may run throughout the shift but produce fewer units than its ideal cycle time allows.
Minor stops are brief pauses that each appear insignificant. Repeated across a shift, they can reduce total output by a meaningful percentage without ever appearing in a downtime log.
Both losses are among the most underreported in manual OEE tracking. They often fall below the threshold operators choose to record, which makes performance data less reliable over time.
3. Changeover delays and inconsistent setup times
Changeovers reduce both availability and performance when setup time varies between operators, products, or shifts. A procedure that takes 20 minutes on one shift may take 45 minutes on another.
This variation makes the production schedule harder to control and OEE comparisons less meaningful. Standardising changeover steps reduces lost time and helps teams track performance consistently across shifts.
4. Material shortages and poor production scheduling
Production can stop even when equipment is fully operational. If raw materials, packaging, or components are unavailable, the line waits rather than produces.
OEE captures this loss under availability, but identifying the cause requires visibility into inventory and procurement.
Poor scheduling and inaccurate stock data are common contributors that sit outside the maintenance team’s direct control. For Australian manufacturers managing lead times or delays, material-related availability losses are significant.
5. Scrap, defects, and rework
Defects reduce quality and increase production cost at the same time. A line may produce high unit volumes but deliver fewer saleable products than the output count suggests.
Each rejected unit represents wasted machine time, material, and labour. Rework adds further cost and can delay downstream production or delivery schedules.
OEE surfaces this loss through the quality factor. When quality falls consistently below target, the team has a measurable signal to investigate materials, tooling, process settings, or operator handling.
6. Manual data entry and delayed reporting
Manual OEE tracking depends on consistent data entry. When operators record downtime after the shift ends, short stops are missed, and reason codes become less accurate.
Delayed reporting also slows response. If a performance issue only appears in a report the following morning, the same problem may affect multiple shifts before anyone investigates.
Inconsistent reason codes create a further problem. Aggregated data becomes harder to analyse across shifts or lines, which limits how useful OEE trends are for improvement planning.
Key benefits of OEE in manufacturing
OEE gives manufacturers a structured way to measure equipment performance and identify where improvement will have the most impact. Its benefits extend from the production floor to financial and operational reporting.
1. Reduces unplanned downtime
OEE tracks availability loss, making downtime visible and measurable. Teams can identify recurring failures on specific machines or shifts and build maintenance plans around actual performance patterns.
Moving from reactive repairs to planned interventions reduces the frequency and duration of unplanned stops. For high-volume production environments, even modest improvements in availability translate to meaningful output gains.
2. Improves machine utilisation
OEE shows whether existing equipment is being used effectively. A machine running at 65% OEE still has significant capacity available before a capital investment becomes necessary.
For Australian manufacturers managing the cost of imported or specialised machinery, improving utilisation is often a faster and lower-risk path to increased output than purchasing additional assets.
3. Increases output without adding new equipment
Small improvements in availability, performance, or quality can increase total good output meaningfully. A line that moves from 70% to 80% OEE produces significantly more usable units from the same equipment and labour budget.
This is especially valuable when demand increases, but capital budgets are constrained. OEE improvement is one of the few ways manufacturers can grow output without expanding headcount or adding production lines.
4. Improves quality control and reduces rework
OEE connects quality performance to production performance. Instead of reviewing quality and output as separate reports, the quality factor ties defect rates directly to the overall OEE score.
This alignment helps quality and production teams work from the same data. When quality losses increase, both teams can see the impact on OEE, which makes the case for corrective action clearer and faster.
5. Helps lower production costs
Downtime, slow cycles, and defects each create cost. They increase labour waste, material usage, maintenance pressure, and the risk of missed delivery commitments to customers.
By identifying the largest loss factor first, OEE helps manufacturers direct improvement effort where it will have the most measurable impact, rather than spreading attention across the full operation.
6. Gives leaders clearer production visibility
OEE provides a single score that senior leaders can track, supported by three component metrics that operations teams can act on directly. This structure creates clearer reporting between different levels of the business.
Plant managers, supervisors, maintenance teams, and finance can all work from the same production data without needing separate reports for each function. This reduces reporting overhead and improves decision speed.
How to improve OEE in manufacturing
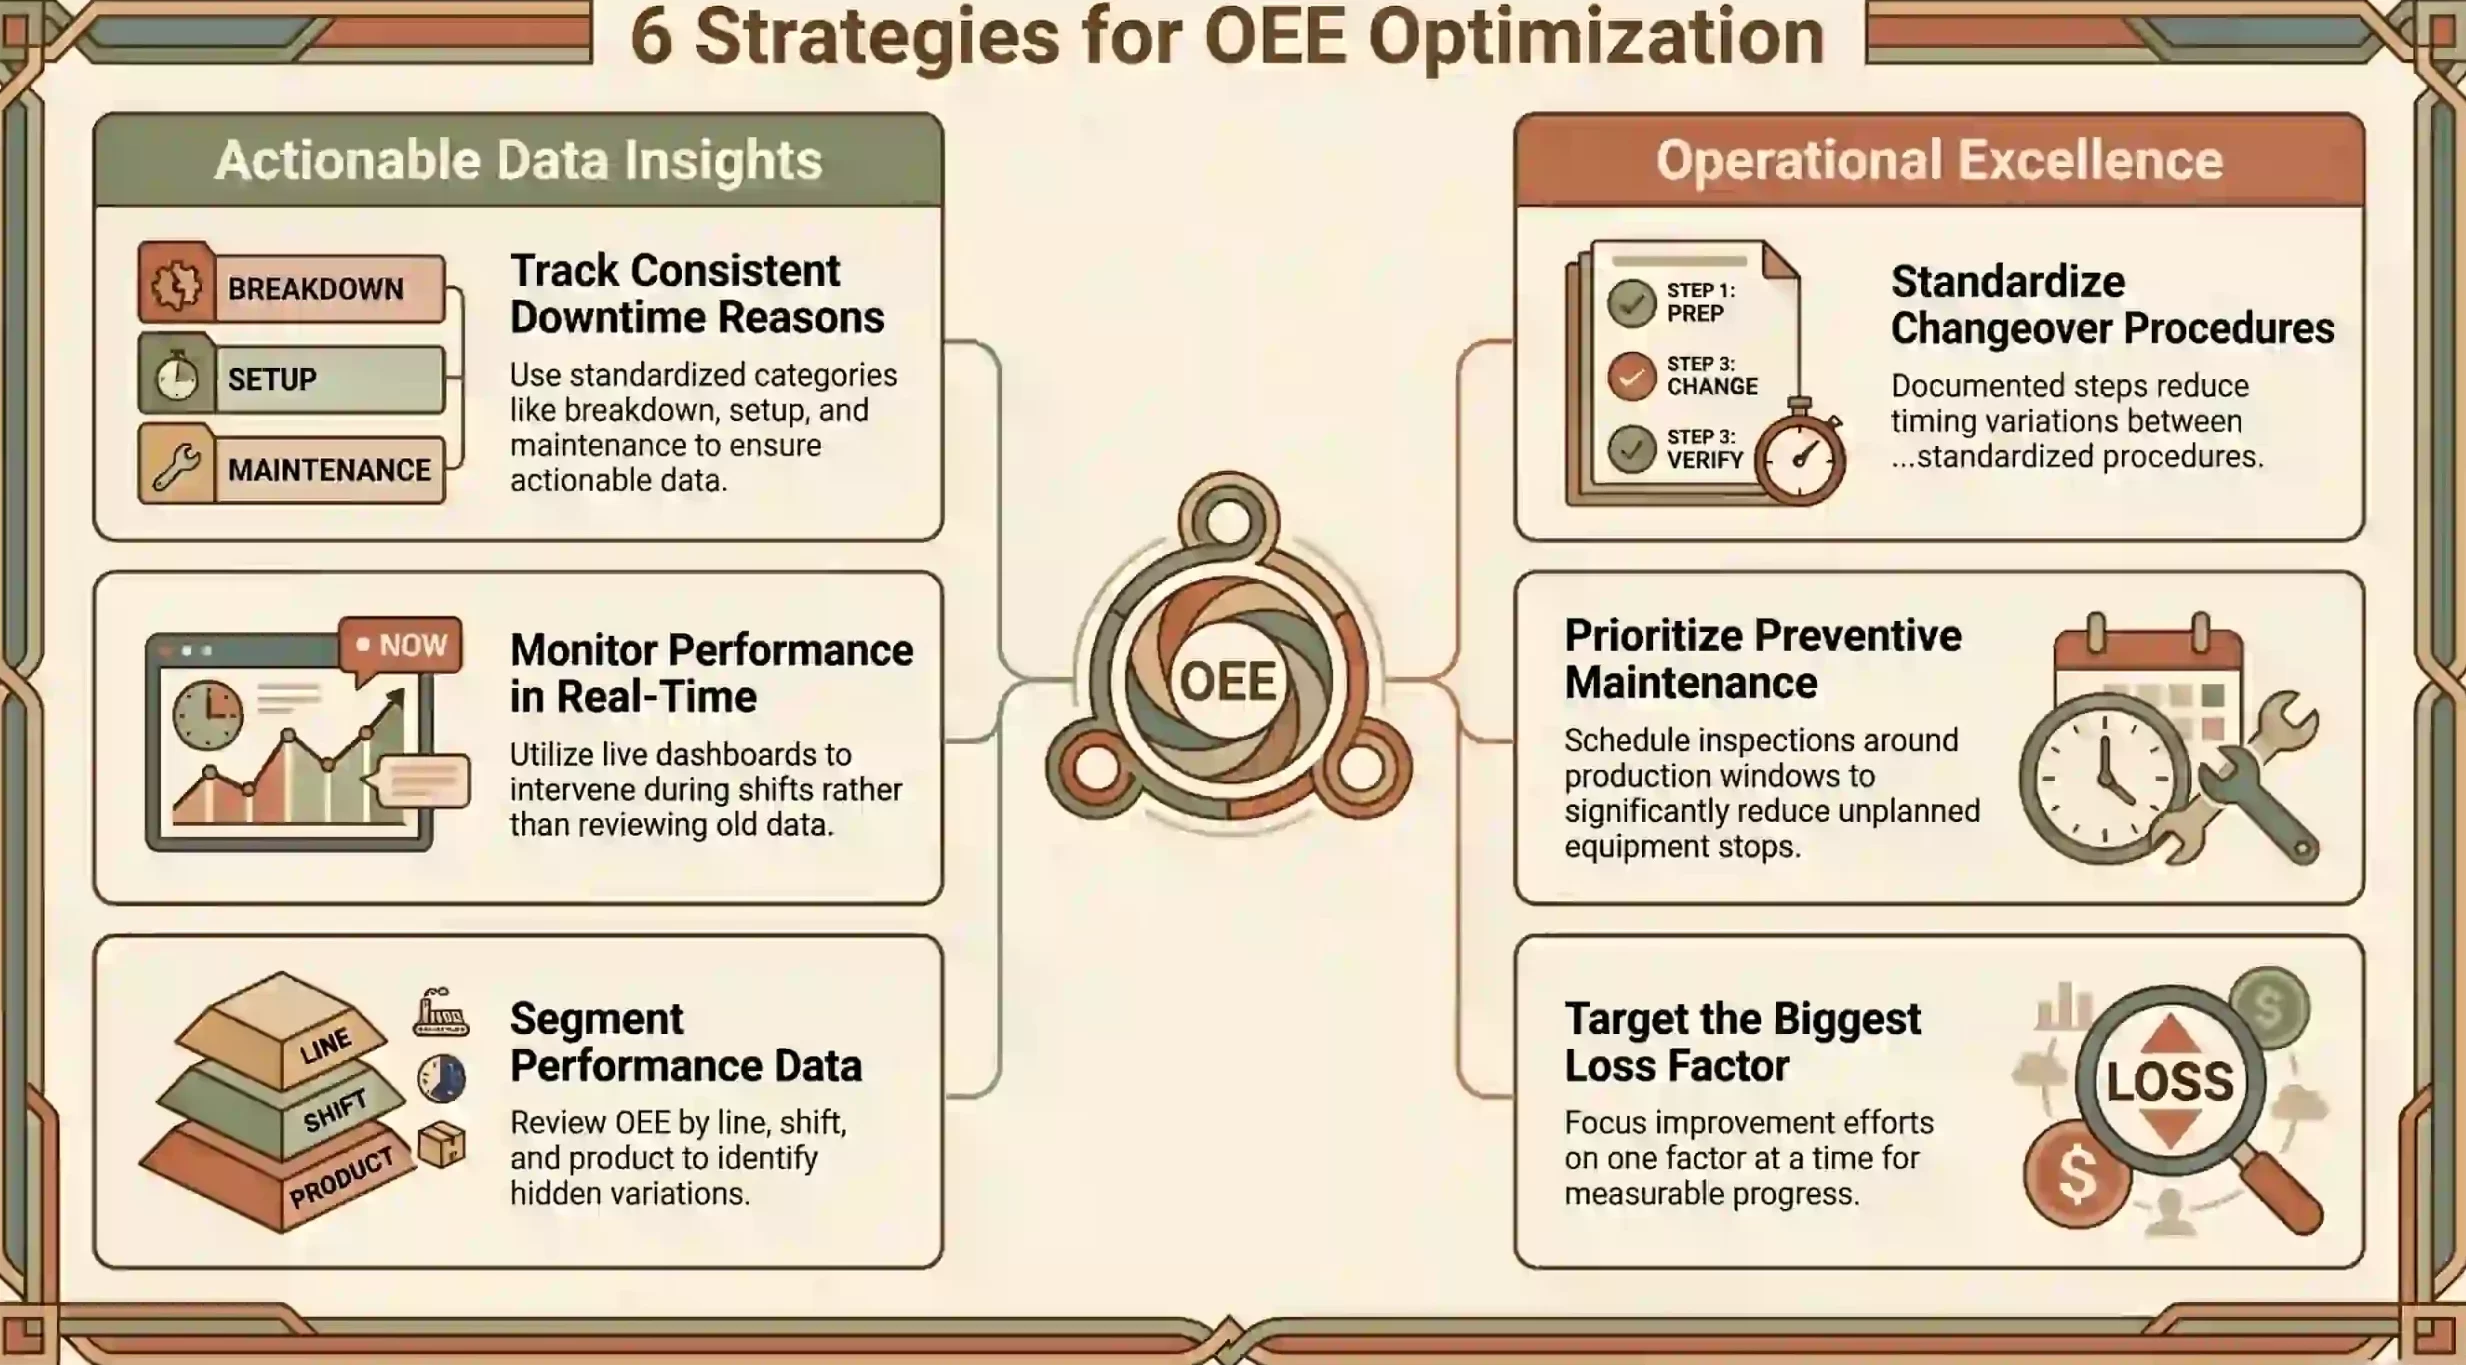
Improving OEE requires consistent data, targeted action, and regular review. The most effective efforts focus on one loss factor at a time, using actual performance data rather than broad assumptions about what needs fixing.
1. Track downtime reasons consistently
Downtime data is only actionable when it is consistent. Use clear reason categories: breakdown, setup delay, material shortage, operator issue, quality failure, or planned maintenance.
Consistent reason codes make recurring losses easier to identify and allow reliable comparison across shifts and lines.
Without them, aggregated downtime data reflects recording habits more than actual equipment behaviour.
2. Monitor production data in real time
Real-time data allows managers to respond while the issue is still affecting production. Reviewing OEE only after the shift ends means the same problem may run for hours before it is visible.
Live dashboards that surface downtime alerts, slow cycle warnings, and quality flags give supervisors the information they need to intervene during the shift, not after it.
3. Standardise changeover procedures
Documented changeover steps reduce variation between operators and shifts. When the process is defined and consistently followed, setup time becomes predictable and easier to compare across lines.
Review changeover time by product, line, and operator. Where setup duration varies significantly, investigate whether the procedure is followed correctly or whether the documentation needs updating.
4. Use preventive maintenance schedules
Preventive maintenance reduces the frequency and duration of unplanned stops. Instead of waiting for equipment to fail, teams schedule inspections and servicing around planned production windows.
Maintenance planning should connect to the production schedule. When upcoming jobs are visible to the maintenance team, servicing can be timed to avoid disrupting planned production runs.
5. Reduce material and inventory delays
Material delays lower OEE even when equipment is fully functional. Production teams need accurate inventory data before the shift starts to avoid avoidable waiting time on the line.
Better coordination between inventory, procurement, and production reduces the gap between demand and material availability. This is especially relevant for Australian manufacturers managing extended supplier lead times or import delays.
6. Review OEE by line, shift, product, and site
A single aggregate OEE score can hide significant variation. One line may show persistent downtime while another has a quality problem. One shift may average longer changeovers while another runs close to target speed.
Segmenting OEE data by line, shift, product type, and site reveals where losses actually concentrate. This makes improvement targets more specific and easier to act on than a site-wide average.
7. Set improvement targets based on the biggest loss factor
OEE targets are most effective when tied to the weakest component and aligned with the broader production strategy of the business. If availability is the largest loss, focus on downtime. If performance is lowest, address cycle speed. If quality lags, investigate defects.
Spreading improvement effort across all three factors simultaneously tends to dilute focus and delay results. Acting on one factor at a time keeps teams accountable and progress measurable.
Manual OEE tracking vs manufacturing software
Manual OEE tracking can work in simple environments with one line and a small team. Spreadsheets allow a business to start measuring OEE without a major system change, provided data entry is disciplined and consistent.
As production grows more complex, manual tracking becomes harder to sustain, which is why many businesses adopt digital tools for manufacturers to improve visibility and reporting accuracy.
Without a connected manufacturing system, there is also no visible link between an OEE loss and its operational cause in inventory, procurement, or maintenance. This limits how useful the data is for root cause analysis.
A platform that centralises downtime logs, output records, quality results, and maintenance data gives managers a clearer view of what happened and why.
For manufacturers with broader operational needs, ERP software connects OEE data with production planning, inventory, procurement, and maintenance.
HashMicro’s manufacturing software connects production planning, inventory, maintenance, and reporting in one system, making it a comprehensive system for improving production efficiency while helping teams track OEE and act on performance issues faster
The platform also functions as production workflows integration software, helping manufacturers connect operational data across departments and reduce delays caused by disconnected systems.
OEE in Australian manufacturing
Australian manufacturing spans food production, metal fabrication, industrial machinery, and construction materials, making equipment effectiveness a priority across a wide range of production environments.
According to the Australian Bureau of Statistics, the manufacturing industry employed over 860,000 people in Australia in 2023-24, with wages and salaries growing 5.8% over the same period.
For businesses operating in this environment, production efficiency is not a theoretical goal. Labour costs, energy prices, and supply chain pressures mean every unit of lost capacity carries a real cost.
OEE gives local manufacturers a practical way to improve output visibility before expanding capacity. This is especially valuable for multi-site operations managing import delays, seasonal demand shifts, or workforce constraints.
Conclusion
OEE measures how effectively planned production time converts into good output. The three-factor score shows whether losses came from downtime, slow cycles, or defects.
For Australian manufacturers, OEE is most useful when it leads to action. Manufacturing software centralises production, inventory, and reporting so teams can act before losses reach the next shift.
If you are interested in learning further, you can book a free consultation with us anytime. Start today and scale your business.

Frequently Asked Questions
-
What are the biggest factors that reduce OEE in manufacturing?
The most common factors are unplanned downtime, slow cycle times, and defective output. Downtime reduces availability, speed losses reduce performance, and defects or rework reduce quality. Changeover delays, material shortages, and inconsistent maintenance planning also contribute to lower OEE scores.
-
How often should manufacturers measure OEE?
OEE should be measured every shift at minimum. Real-time tracking gives teams the ability to respond to downtime or quality issues during production rather than after the shift ends. Weekly and monthly reviews help identify longer-term trends across lines, products, and sites.
-
Can a machine have high availability but low OEE?
Yes. A machine can run throughout the entire planned production window but still produce a low OEE score if it operates below its ideal speed or generates a high number of defective units. Availability only measures whether the machine was running, not how well it performed during that time.
-
Should OEE be measured by machine, line, shift, or site?
Ideally, all four. A single site-level OEE score can hide significant differences between machines, lines, or shifts. Measuring at each level helps managers pinpoint exactly where production losses are occurring and compare performance more accurately across the operation.
-
What data is needed to track OEE accurately?
Accurate OEE tracking requires planned production time, actual run time, downtime events with reason codes, total units produced, good units accepted, and the ideal cycle time for each product. Without consistent reason codes and real-time capture, downtime and short stops are often missed or misclassified.


