


Companies nowadays face mountains of data. Website visits, social media activity, sales figures, and staff retention can quickly overwhelm. KPIs give leaders clear, actionable metrics to focus on what really drives growth.
Smart businesses turn data into insights. By picking metrics that align with core goals, teams can cut through the noise. KPIs help improve staff performance, streamline processes, and boost profits.
Using KPIs across departments ensures measurable results and accountability. They guide decisions, track progress, and keep Australian businesses competitive. When applied correctly, KPIs become essential tools for long-term success.
Key Takeaways
KPIs connect metrics directly to strategic goals, ensuring every action contributes to business success.
KPIs enable data-driven decisions, align teams, and highlight areas that need immediate attention.
Companies should track strategic, operational, functional, and leading vs lagging indicators for a balanced view.
Predictive analytics and AI-driven dashboards empower proactive decision-making and agile business strategies.
Understanding Key Performance Indicators
To understand the strategic value of business metrics, companies need a clear definition of key performance indicators. A KPI is a measurable value used to track progress toward important business goals. Unlike basic metrics, KPIs directly link to strategy and answer the question: “Are we achieving our desired outcomes?”
Many people confuse metrics with KPIs. A metric measures any business activity, like website visits or daily foot traffic. A KPI, however, focuses on what matters most, such as converting website visitors into paying customers when boosting online sales is the goal.
A strong KPI has several key components. It includes a target, the measure used to track it, a reliable data source, and a set frequency for review. These indicators must adapt as the business grows, shifts focus, or enters new markets. Understanding KPIs is an ongoing process that keeps companies aligned with their evolving goals.
Why KPIs Matter for Organizations
KPIs are not just a corporate formality, they drive business success. They give clarity, focus, and alignment across all levels. From executives to frontline staff, KPIs guide decisions and daily actions.
Tracking Business Performance
KPIs help companies monitor progress and spot issues early. By comparing results against targets, leaders can see if the business is improving or falling behind.
For example, a manufacturing company tracking its First Pass Yield can quickly identify problems in production. Early detection prevents wasted time, lost revenue, and unhappy customers.
Supporting Data-Driven Decisions
Relying on gut feelings is risky in today’s market. KPIs give objective evidence to guide strategic decisions and resource allocation.
For instance, comparing Customer Acquisition Cost and ROI helps marketing teams choose the most effective channel. Data-driven choices reduce errors and increase returns.
Aligning Teams with Business Goals
KPIs connect individual tasks to overall business strategy. They help teams understand how their work supports company goals.
A software company might align teams with a retention goal: customer service tracks resolution times, developers monitor critical bugs, and customer success measures Net Promoter Score. All contribute to keeping customers loyal.


Common Types of KPIs

Businesses are complex, so one-size-fits-all KPIs don’t work. Companies need different types of indicators to track both daily operations and long-term strategy. Understanding these types helps leaders measure performance effectively.
Strategic KPIs
Strategic KPIs track the overall health and long-term goals of a company. Executives use them to see if the business is moving in the right direction.
Examples include revenue growth, market share, gross profit margin, and return on equity. These metrics change slowly but reveal if big-picture strategies, like expansion or new business models, are working.
Operational KPIs
Operational KPIs focus on daily or weekly business processes. Managers use them to ensure teams are efficient and workflows run smoothly.
In logistics, this might be average delivery time or on-time shipments. In call centres, it could be average handle time or calls answered within the first ring. Early issues in these metrics warn of future strategic problems.
Functional or Departmental KPIs
Functional KPIs measure the performance of specific teams, such as HR, IT, marketing, or finance. Each department has unique goals and success metrics.
For example, HR might track employee turnover and time-to-hire. IT could measure system uptime and incident resolution times. These KPIs ensure each department contributes effectively to the company’s overall objectives.
Leading vs Lagging KPIs
Lagging indicators show results of past actions, like total sales or customer churn. They are reliable but only reflect history.
Leading indicators predict future outcomes, such as outbound sales calls or proposals sent. Monitoring these allows companies to act proactively and influence results before problems occur.
Examples of KPIs Across Departments
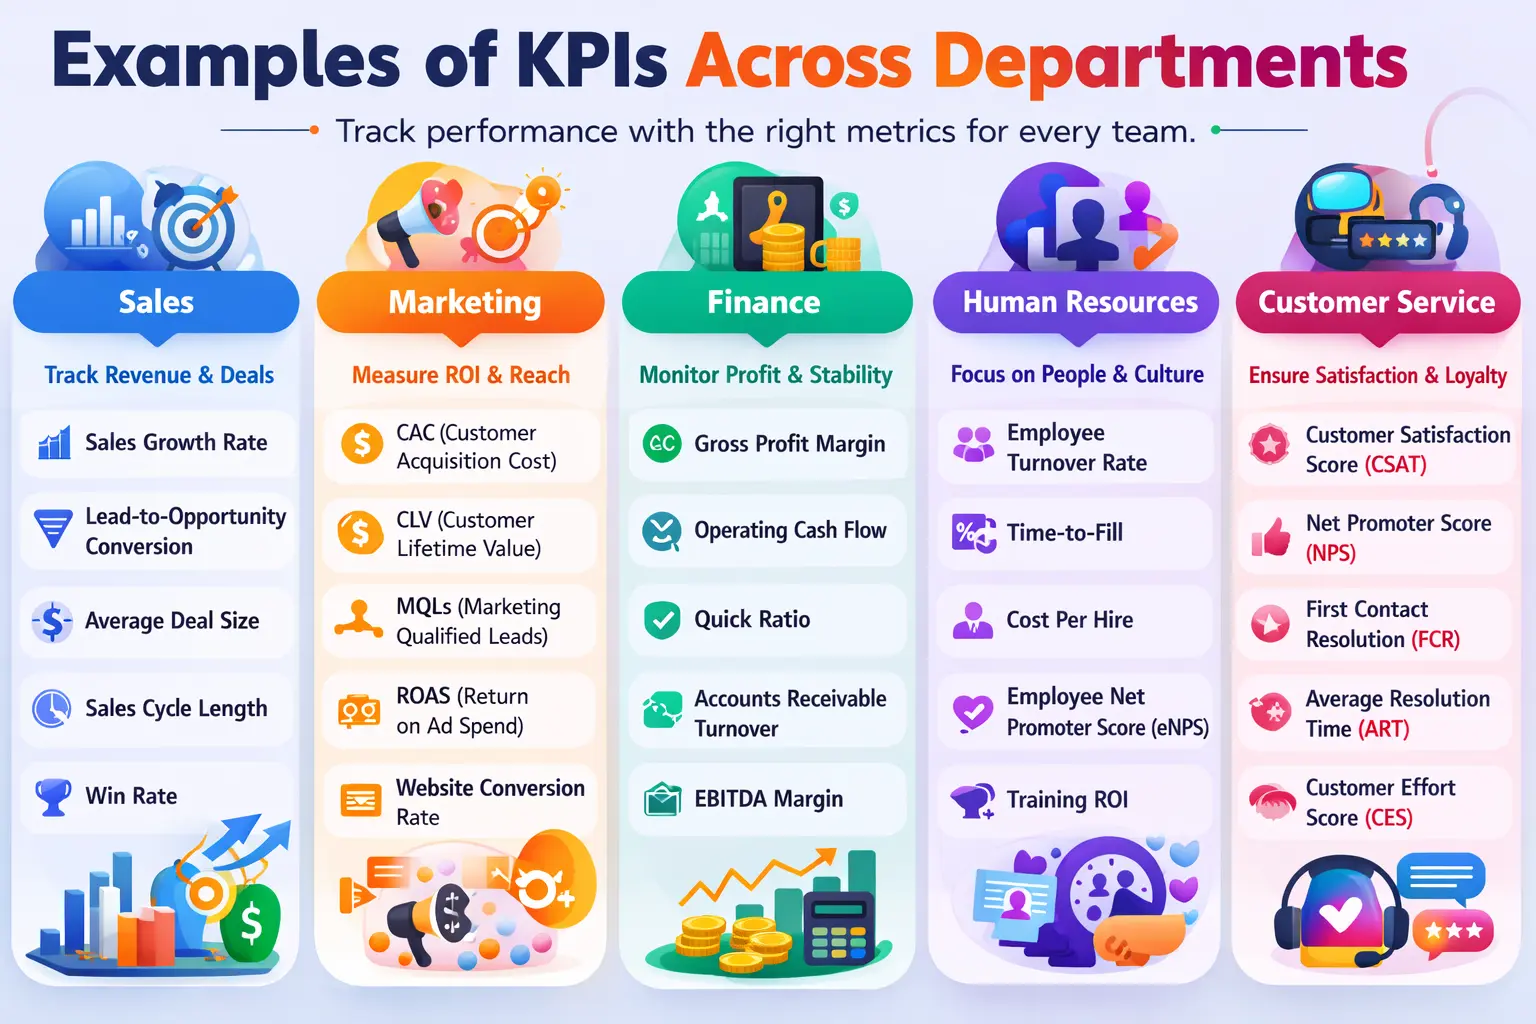
KPIs work best when applied to real-world business functions. Different departments need tailored metrics to track performance. Using these examples helps companies build dashboards that cover all key areas.
1. Sales KPIs
Sales teams drive revenue, so their KPIs focus on pipeline efficiency and deal success. Tracking these metrics helps identify what tactics work and what wastes time.
Common examples include sales growth rate, lead-to-opportunity conversion, and average deal size. Monitoring these shows if the team is hitting targets or needs support.
Other useful KPIs are sales cycle length and win rate. Shorter cycles and higher win rates indicate efficient processes and effective sales strategies.
2. Marketing KPIs
Marketing KPIs show how campaigns and brand efforts impact sales. They measure ROI and help justify marketing spend.
Key metrics include Customer Acquisition Cost (CAC), Customer Lifetime Value (CLV), and Marketing Qualified Leads (MQLs). These reveal the cost and quality of new customer growth.
Return on Ad Spend (ROAS) and website conversion rates track campaign efficiency. They highlight which channels deliver the best results.
3. Finance KPIs
Finance KPIs track profitability, liquidity, and operational efficiency. They provide a clear picture of the company’s financial health.
Metrics like gross profit margin, operating cash flow, and quick ratio show production efficiency and the ability to meet short-term obligations.
Accounts receivable turnover and EBITDA margin help investors and management evaluate revenue collection and core profitability.
4. Human Resources KPIs
HR KPIs focus on employee retention, recruitment, and workforce productivity, often supported by HR software for KPI tracking to improve visibility across the workforce. They ensure the company maintains a strong talent pool.
Examples include employee turnover rate, time-to-fill, and cost-per-hire. These highlight recruitment efficiency and workforce stability.
Other metrics like Employee Net Promoter Score (eNPS) and training ROI measure satisfaction, engagement, and employee value based on KPI results linked to development programs.
5. Customer Service KPIs
Customer service KPIs measure speed, quality, and effectiveness of support. They directly affect loyalty and brand reputation.
Key metrics include Customer Satisfaction Score (CSAT), Net Promoter Score (NPS), and First Contact Resolution (FCR). These show satisfaction and issue resolution efficiency.
Average Resolution Time (ART) and Customer Effort Score (CES) track how quickly and easily issues are solved. They help reduce frustration and improve customer retention.
How to Set Effective KPIs
Understanding the various types of indicators and reviewing examples is only half the battle. The true challenge lies in the
Industry-Specific KPI Use Cases
KPIs differ by industry and help businesses track performance and stay competitive. Understanding these examples shows how metrics apply in practice.
- Software as a Service (SaaS): Companies measure MRR, Churn Rate, and CAC. These KPIs track subscription growth, customer retention, and the effectiveness of marketing spend.
- Manufacturing: Metrics like OEE, Cycle Time, and Defect Density monitor efficiency and quality. They help reduce waste, maximise output, and maintain safety standards.
- Retail and E-commerce: Track AOV, Inventory Turnover, and Cart Abandonment. These KPIs optimise sales, improve stock management, and boost online conversions.
Essential Implementation Steps
Deploying a new performance measurement framework requires a careful approach. Start by auditing your current data collection methods to establish a clear baseline and ensure data accuracy. Involving key stakeholders from different departments helps define strategic objectives and ensures everyone is aligned.
After setting goals, choose a focused list of indicators. Experts recommend five to seven core metrics per department to avoid data overload. Clear, concise KPIs keep teams focused on what truly drives performance.
Finally, use a business intelligence tool or central dashboard to automate data tracking. This gives teams real-time, reliable insights without relying on manual spreadsheets. Automated dashboards make performance monitoring faster and more accurate.
Common Pitfalls in Performance Tracking
Even with the best intentions, companies often struggle when setting up measurement frameworks. A common mistake is focusing on vanity metrics. Numbers like total social media followers or website page views may look impressive but offer little insight into revenue, customer satisfaction, or growth.
Tracking too many indicators at once is another pitfall. Dashboards overloaded with metrics create confusion and make it hard for leaders to know which areas need immediate attention.
Failing to regularly review and update targets can also hurt performance. Metrics that mattered during a startup phase may become irrelevant as the company grows, making it essential to adapt KPIs over time.

Advanced Practices and Future Trends
As companies improve their data literacy, they are moving beyond basic reporting and embracing predictive analytics. Using machine learning, businesses can analyze past data to forecast future trends. This allows leaders to adjust strategies before problems like market dips or supply chain delays occur.
Artificial intelligence is also changing how dashboards work, making KPI review using AI faster and more responsive through automated alerts and pattern detection. Automated alerts notify managers immediately when key metrics deviate from expected levels. This removes the need to wait for monthly or quarterly reviews to spot issues.
These technologies enable agile decision-making and faster responses. Companies can act proactively, stay resilient, and adapt quickly to changes in the global market. Predictive and AI-driven insights are becoming essential for modern business success.

Conclusion
KPIs are more than numbers; they are strategic tools that guide every level of a business. When chosen wisely, they improve performance, align teams, and support data-driven decisions. Consistent tracking ensures companies remain competitive and focused on growth.
Implementing KPIs effectively requires clarity, collaboration, and the right technology. Advanced tools like AI dashboards and predictive analytics enable proactive decision-making. For tailored guidance on setting up KPIs, you can consult our experts without cost and explore the right approach for your business.
Frequently Asked Questions Key Performance Indicators
-
What is a Key Performance Indicator (KPI) and why is it important?
A KPI is a measurable value that shows how effectively a company is achieving its strategic goals. KPIs provide clear insight into performance, helping leaders make informed decisions and align teams toward growth.
-
How do KPIs differ from regular business metrics?
While a metric tracks any business activity, a KPI focuses on what matters most to achieving strategic objectives. For example, website visits are a metric, but conversion rate becomes a KPI when the goal is to boost online sales.
-
What are the most common types of KPIs used by companies?
Common KPI types include strategic (long-term goals), operational (daily efficiency), functional or departmental (team-specific performance), and leading vs lagging indicators (predictive vs historical results).
-
How can departments like sales, marketing, and HR use KPIs effectively?
Departments use KPIs to track performance, measure outcomes, and align their work with overall business goals. For example, sales teams track conversion rates, marketing monitors CAC and ROAS, and HR focuses on turnover and employee engagement.
-
What are the best practices for implementing KPIs in a business?
Start with clear strategic objectives, select a focused list of core metrics, and automate tracking with dashboards or BI tools. Regularly review and update KPIs to ensure they stay relevant as the business evolves.


