


 (42)")
Inventory days measures how long inventory stays in storage before it is sold. It reflects how efficiently stock is moving and how quickly it turns into revenue, making it a key indicator of overall inventory performance.
In practice, inventory days connects stock levels with sales activity. By analysing how fast products move, businesses can identify slow-moving items, optimise stock levels, and make more informed decisions to improve cash flow and operational efficiency.
This blog explains what inventory days are, how to calculate them, the benchmarks Australian businesses target, and how to use the metric to improve inventory planning accuracy across operations.
Key Takeaways
Understand what inventory days reveals about stock movement, demand alignment, and operational efficiency.
See why inventory days directly impacts cash flow, stock control, and overall business performance.
Learn how the inventory days formula works to measure how long stock stays before being sold.
Follow a clear method to calculate inventory days using average inventory, COGS, and turnover.

What Inventory Days Reveals About Your Stock
Inventory days goes beyond a simple metric. It shows how well inventory is aligned with actual demand and how efficiently stock is being managed across operations.
A lower number typically indicates faster movement, meaning products are sold quickly and capital is not tied up for long. On the other hand, higher inventory days can signal slow-moving stock, excess inventory, or gaps in demand planning.
More importantly, this metric helps highlight hidden inefficiencies. It can reveal issues such as over-ordering, poor product turnover, or delays in moving goods through the supply chain, giving businesses a clearer view of where adjustments are needed.
Pairing this metric with a strong stock tracking system gives managers real-time visibility over every SKU, turning inventory days from a backward-looking number into a live signal that drives faster decisions.
Why Inventory Days Matters for Business Performance
Inventory days directly impacts how efficiently a business operates and how effectively it manages working capital. It connects inventory decisions with financial outcomes, making it a critical performance indicator.
Key reasons it matters:
- Measures operational efficiency
Faster inventory movement indicates that stock is managed effectively and aligned with demand. - Supports better cash flow management
Lower inventory days means less capital tied up in stock, freeing up cash for other business needs. - Helps prevent overstocking risks
Monitoring inventory days allows businesses to detect excess stock early and avoid unnecessary holding costs.
By tracking this metric consistently, businesses can balance stock availability with demand while maintaining financial stability.


Inventory Days Formula and How It Works
Inventory days is calculated using two common formulas, both designed to measure how long inventory remains before being sold.
1. Based on inventory turnover:
Inventory Days = 365 / Inventory Turnover
This approach shows how many days it takes to sell inventory based on how frequently stock is turned over within a year.
2. Based on inventory and cost of goods sold:
Inventory Days = 365 × (Average Inventory ÷ Cost of Goods Sold)
This formula links inventory value with sales cost, giving a more detailed view of how long stock is held.
In practice, both formulas lead to the same insight. They translate inventory movement into time, making it easier to understand how efficiently stock flows through the business.
How to Calculate Inventory Days
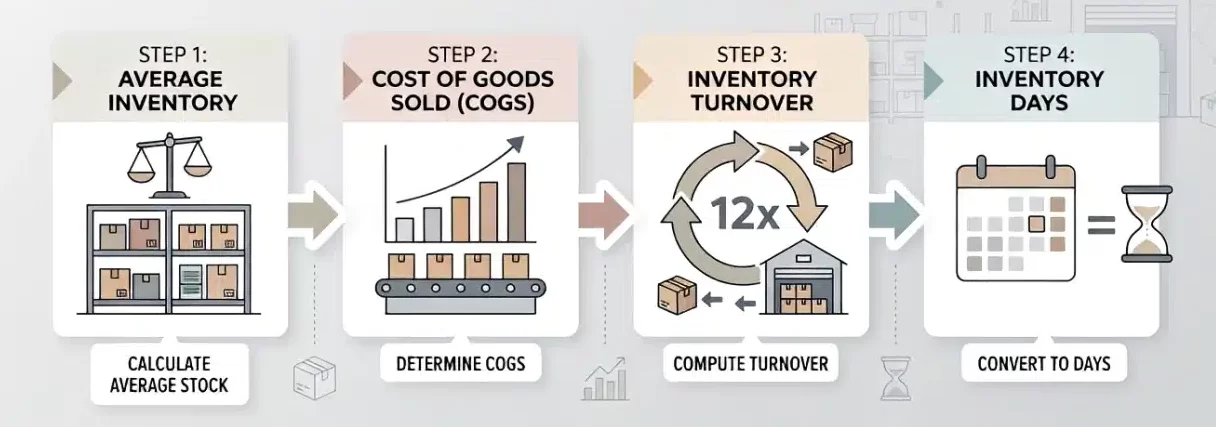
Calculating inventory days helps translate stock movement into a clear time-based metric. The process combines inventory value and sales performance to show how long items stay before being sold.
1. Calculate average inventory
Start by finding the average inventory over a period. This smooths out fluctuations and gives a more stable baseline.
Average Inventory = (Beginning Inventory + Ending Inventory) / 2
2. Determine cost of goods sold (COGS)
COGS represents the direct cost of producing or purchasing the goods sold during the period. This figure is typically available in financial statements.
3. Calculate inventory turnover
Inventory turnover shows how many times inventory is sold and replaced within a period.
Inventory Turnover = Cost of Goods Sold / Average Inventory
4. Apply the inventory days formula
Once turnover is calculated, convert it into days to understand how long stock is held.
This final result gives a clear view of how quickly inventory moves through the business.
What Counts as a Good Inventory Days Range
Inventory days varies depending on business type, product category, and demand patterns, so there is no single benchmark that fits all industries.
Lower inventory days generally means faster stock movement and better efficiency, but if too low, it can lead to stock shortages. Higher inventory days often indicate slow-moving or excess stock, which ties up capital and increases holding costs.
Industry context plays a major role. For example, fast-moving consumer goods typically have lower inventory days, while industries with longer production cycles or specialised products tend to operate with higher ranges.
Rather than aiming for a fixed number, businesses should focus on maintaining a balance where inventory moves efficiently without risking stockouts or excess holding.
The table below shows typical inventory days ranges across different industries to provide general context for comparison.
| Industry | Typical Inventory Days | Interpretation |
| Retail (FMCG) | 30 – 60 days | Fast-moving goods with high turnover |
| Manufacturing | 60 – 120 days | Longer production and storage cycles |
| Wholesale | 45 – 90 days | Moderate turnover with bulk inventory |
| Luxury / Specialised Goods | 120+ days | Slower movement with higher margins |
What Impacts Your Inventory Days

Inventory days is influenced by multiple operational and market factors. These elements shape how quickly stock moves and how efficiently it is managed.
Demand variability
Fluctuations in customer demand can significantly affect inventory movement. Sudden drops in demand often lead to slower turnover and higher inventory days.
Lead time and supply chain efficiency
Long or inconsistent lead times can force businesses to hold more stock as a buffer, increasing inventory days. Efficient supply chains help keep stock levels lean.
Inventory management practices
Poor stock planning, inaccurate forecasting, or lack of visibility can result in excess inventory. On the other hand, inventory tools for Australian business support better control and faster movement.
How to Improve Inventory Days in Practice
Improving inventory days is about aligning stock levels with real demand while keeping operations responsive. The goal is not just to reduce the number, but to make inventory movement more efficient and predictable.
1. Optimise inventory levels
Review stock regularly to identify slow-moving or excess items. Reducing unnecessary stock helps free up capital and lowers holding costs without affecting availability.
2. Improve demand forecasting accuracy
Use historical data and sales trends to improve future demand prediction. Better forecasting reduces the risk of overstocking or understocking, keeping inventory days within a healthy range.
3. Reduce lead time
Work closely with suppliers to shorten delivery times and improve consistency. Faster replenishment allows you to hold less stock while still meeting demand.
4. Streamline inventory processes
Use stock tracking system to manage and streamline inventory across locations. Clear processes reduce delays, minimise errors, and support faster stock movement.
5. Use inventory management systems
Stock optimisation tools provide real-time visibility into stock levels, movement, and demand patterns. This makes it easier to adjust inventory decisions quickly and maintain optimal stock flow.

Inventory Days vs Inventory Turnover
Inventory days and inventory turnover measure the same concept from different angles. While they are closely related, each provides a different perspective on how inventory performs.
Inventory turnover shows how many times inventory is sold and replaced within a period. A higher turnover means stock is moving quickly, indicating strong sales or efficient inventory management.
Inventory days, on the other hand, translates that movement into time. It shows how many days inventory remains before being sold, making it easier to interpret in operational terms.
In practice, both metrics should be used together. Inventory turnover highlights speed, while inventory days provides context, helping businesses understand whether stock levels are aligned with demand and operational goals.
Conclusion
Inventory days provides a clear view of how efficiently stock moves and how well inventory aligns with demand. By understanding and managing this metric, businesses can reduce excess stock, improve cash flow, and operate more efficiently.
To optimise your inventory performance, using the right system can make a significant difference. Consult our expert with no cost to find the best solution for managing inventory and improving stock visibility.

Frequently Asked Questions About Inventory Days
-
How often should inventory days be calculated?
Inventory days should be reviewed regularly, typically monthly or quarterly, to track performance trends and identify changes in stock movement.
-
Can inventory days be too low?
Yes. Extremely low inventory days may indicate insufficient stock levels, which can lead to stockouts and missed sales opportunities.
-
Is inventory days the same across all industries?
No. Inventory days varies significantly depending on industry type, product lifecycle, and demand patterns.
-
What tools can help track inventory days more accurately?
Inventory management systems and ERP software help track stock levels, turnover, and performance in real time, improving accuracy and decision-making.
