


![Balance Sheet Template: Free Downloads for Businesses [2026]](https://www.hashmicro.com/au/blog/wp-content/uploads/2026/04/moneymoney-14-150x150.webp)


A profit and loss statement (P&L), or income statement, is a financial report that summarises a business’s revenue, costs, and expenses over a specific period to show whether it made a profit or loss. By subtracting the operating costs from the income, it helps businesses evaluate financial performance, control expenses, and make informed decisions.
A profit and loss statement shows how much a business earns and spends over a specific period. It highlights whether operations are generating profit or creating losses, making it a key indicator of financial performance.
In practice, this report, supported by integrated financial tools for businesses, helps turn financial data into decisions. By reviewing income, costs, and margins, businesses can identify inefficiencies and plan growth more clearly.
Key Takeaways
Understand what a profit and loss statement reveals about revenue, costs, and overall business performance.
Break down the key components that shape gross profit, operating expenses, and final earnings.
Explore different P&L formats used to track performance across monthly, quarterly, and annual reporting.
Use ready-to-download templates to simplify financial reporting and maintain consistent data tracking.

What a Profit and Loss Statement Actually Shows
A profit and loss statement provides a structured view of business performance by tracking revenue, costs, and expenses over time. It focuses on operational results rather than just cash movement.
More importantly, it reveals how efficiently a business converts sales into profit. By breaking down each component, it helps identify where margins improve, where costs rise, and where performance needs attention.
At its core, the statement resolves to a single calculation:
Net Profit (or Loss) = (Revenue − Cost of Goods Sold) − Expenses
Breaking Down the Structure of a P&L Statement
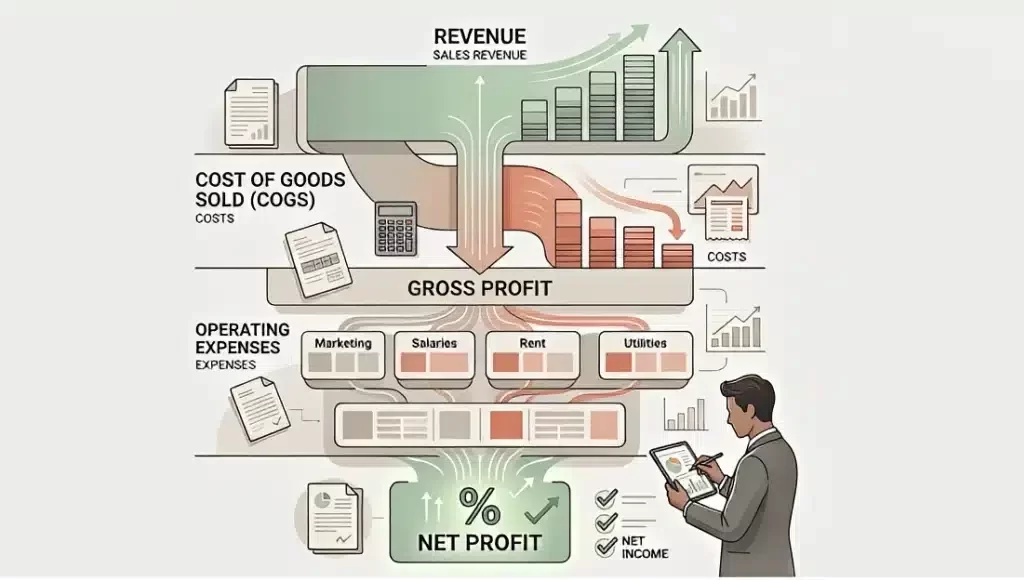
A profit and loss statement follows a structured format that breaks down financial performance into key components. Each section highlights a different part of how revenue is generated and where costs occur.
Revenue and income
Also known as top line, revenue represents all earnings generated from business activities, usually recorded excluding GST. This includes primary sales and any additional income streams.
Cost of Goods Sold (COGS)
Also referred to as cost of sales, COGS captures the direct costs associated with producing goods or delivering services. Examples include raw materials and direct labour.
Gross Profit
Gross profit represents the profit generated from a business’s core products or services. It is calculated by subtracting the cost of sales from revenue (Revenue – Cost of Sales).
Operating expenses
Covers indirect costs such as salaries, rent, utilities, and marketing. These expenses support operations but are not directly tied to production.
Net profit and final earnings
Net profit, or bottom line, is the final result after deducting all expenses, interest, and taxes. This figure reflects the actual financial outcome of the business for the period.
It is calculated by subtracting the operating expenses from gross profit (Gross Profit – Operating Expenses).
The table below shows how a profit and loss statement compares with other key financial reports used in business decision-making.
How Businesses Use P&L for Decision-Making
Businesses use profit and loss statements to evaluate performance beyond surface-level numbers. It helps identify whether growth is sustainable or driven by temporary factors.
By analysing margins and expense patterns, decision-makers can adjust pricing, control costs, and allocate resources more effectively. This makes the P&L a practical tool for both short-term actions and long-term planning.

How to Prepare a Profit and Loss Statement
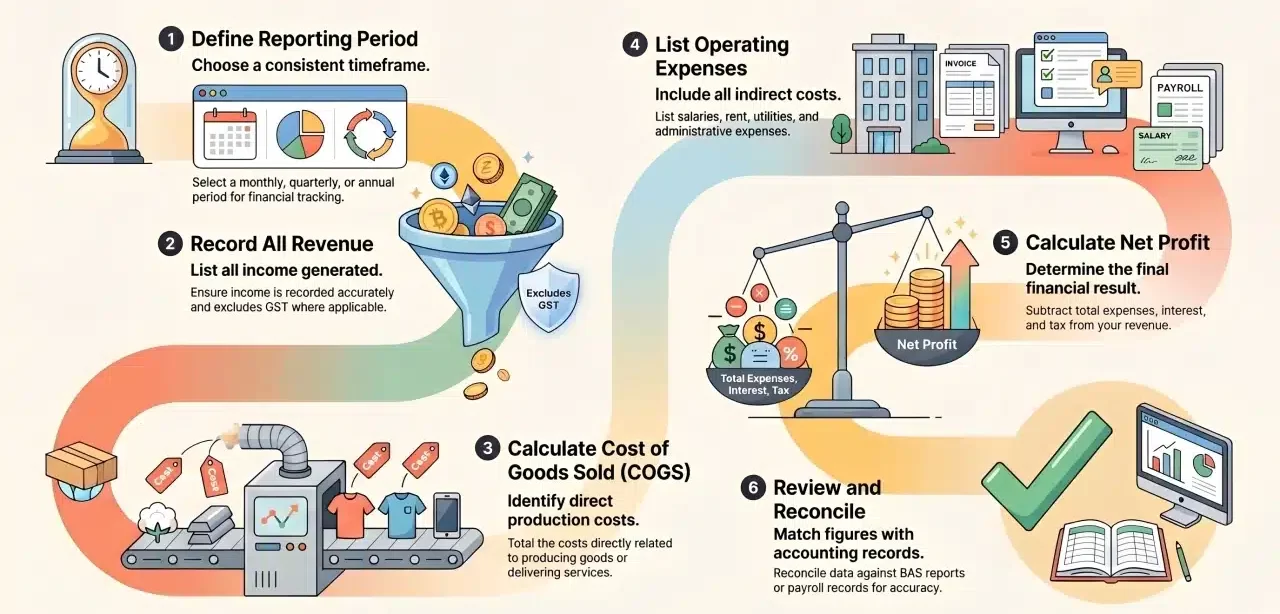
Preparing a profit and loss statement relies on accounting system fundamentals, consistent data, and a clear structure. Each step ensures that income and expenses are recorded accurately and aligned with reporting requirements.
1. Define the reporting period: Choose a timeframe such as monthly, quarterly, or annual reporting to ensure consistent financial tracking.
2. Record all revenue: List all income generated during the period, ensuring it is recorded accurately and excludes GST where applicable.
3. Calculate cost of goods sold (COGS): Identify all direct costs related to producing goods or delivering services to determine gross profit.
4. List operating expenses: Include all indirect costs such as salaries, rent, utilities, and administrative expenses.
5. Calculate net profit: Subtract total expenses, interest, and tax from revenue to determine the final financial result.
6. Review and reconcile data: Ensure all figures match accounting records and reconcile with reports such as BAS or payroll data.
Download Free Profit and Loss Statement Templates
Creating a profit and loss statement manually can lead to inconsistent formats and incomplete data. Using structured templates and financial platform options in Australia helps standardise financial reporting and makes it easier to analyse performance over time.
The templates below are designed for different business needs, from simple tracking to more detailed financial reporting. Each format can be adapted into spreadsheets or integrated into accounting systems.
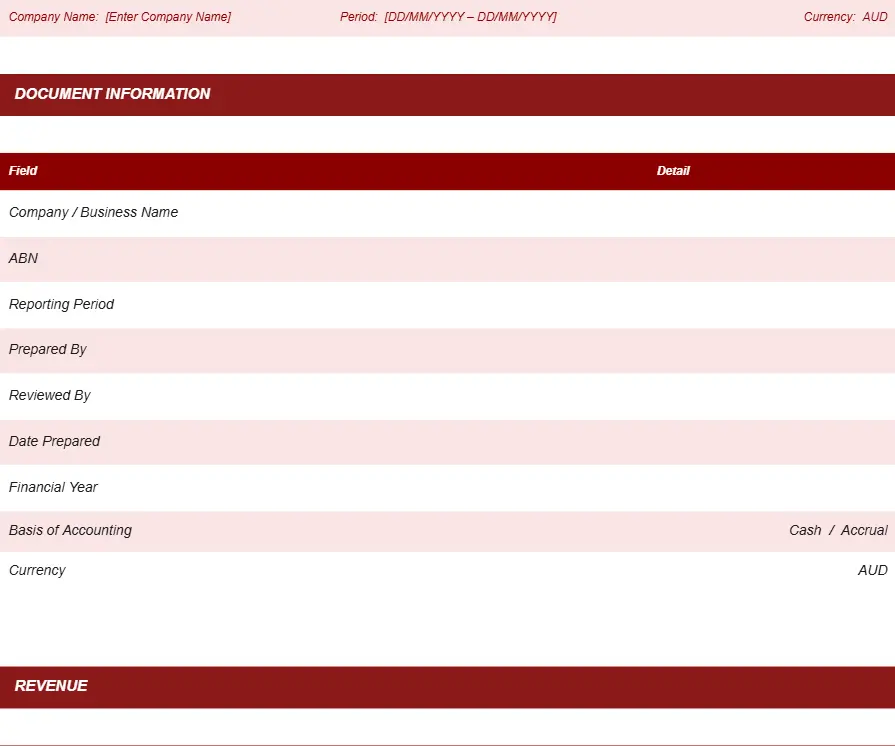
1. Simple P&L template
Designed for small businesses or service-based operations, this template focuses on basic income and expense tracking without complex breakdowns.
SIMPLE PROFIT AND LOSS TEMPLATE
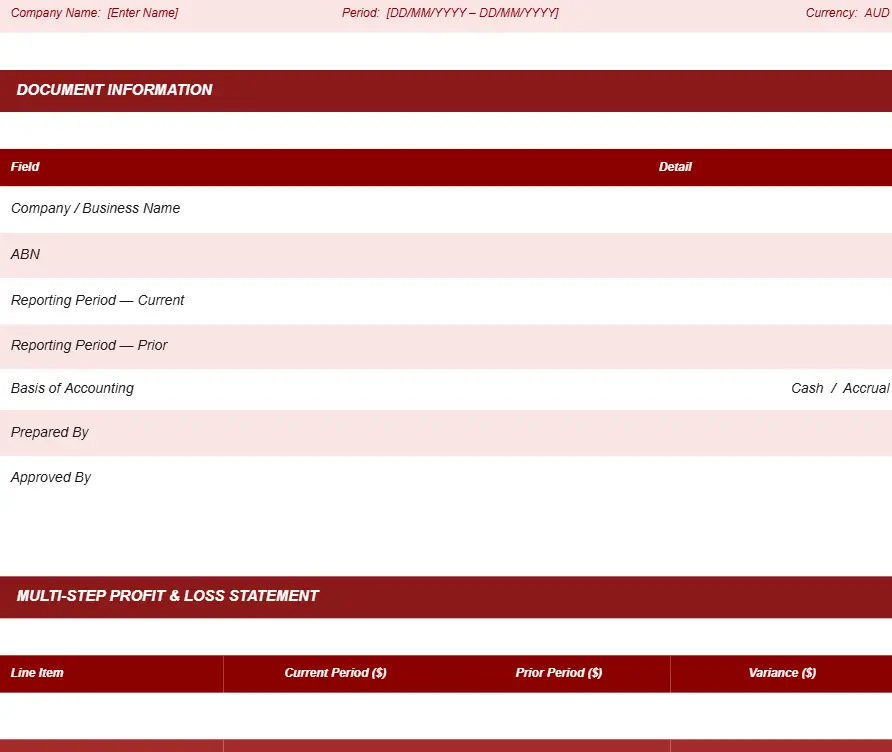
Provides a more detailed structure by separating gross profit, operating profit, and net profit, making it suitable for growing businesses.
MULTI-STEP PROFIT AND LOSS TEMPLATE
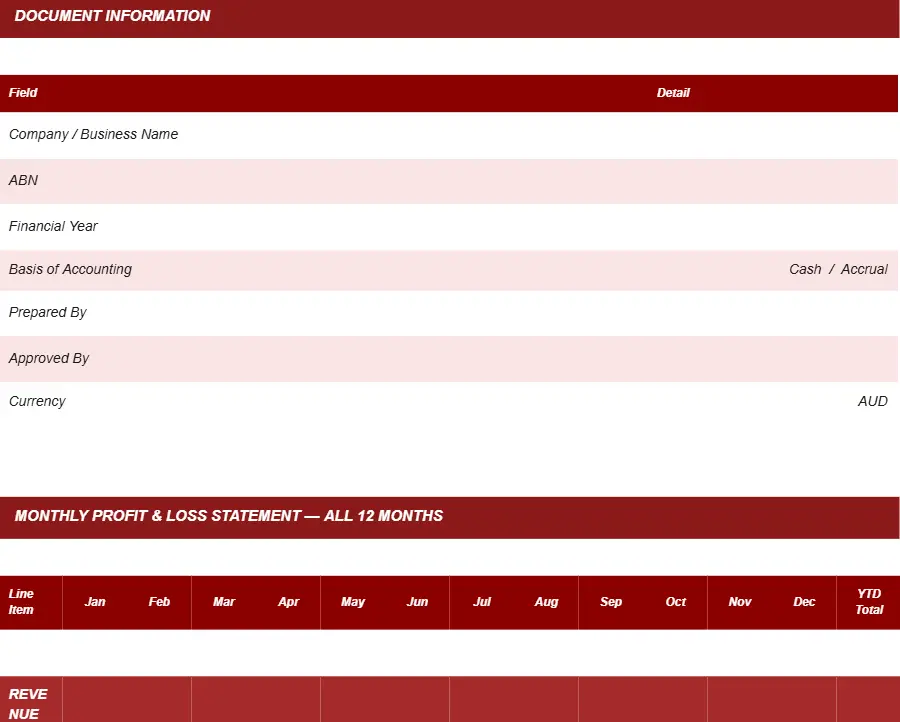
3. Monthly P&L template
Tracks financial performance on a monthly basis, helping businesses monitor trends and make timely adjustments.
MONTHLY PROFIT AND LOSS TEMPLATE
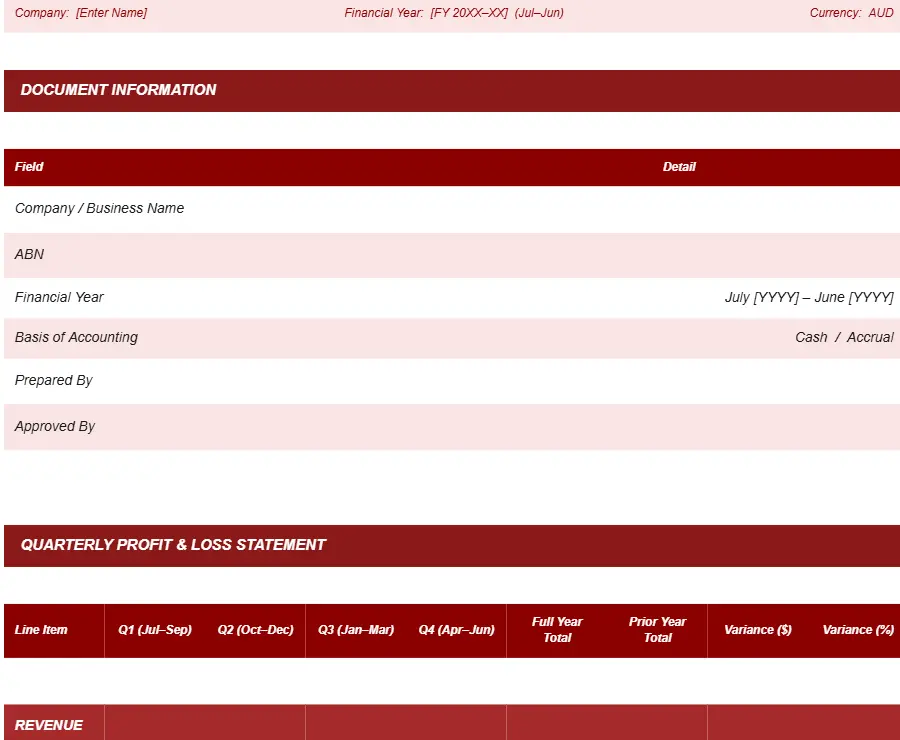
4. Quarterly P&L template
Aligns with reporting cycles such as BAS, making it easier to review performance and ensure compliance.
QUARTERLY PROFIT AND LOSS TEMPLATE
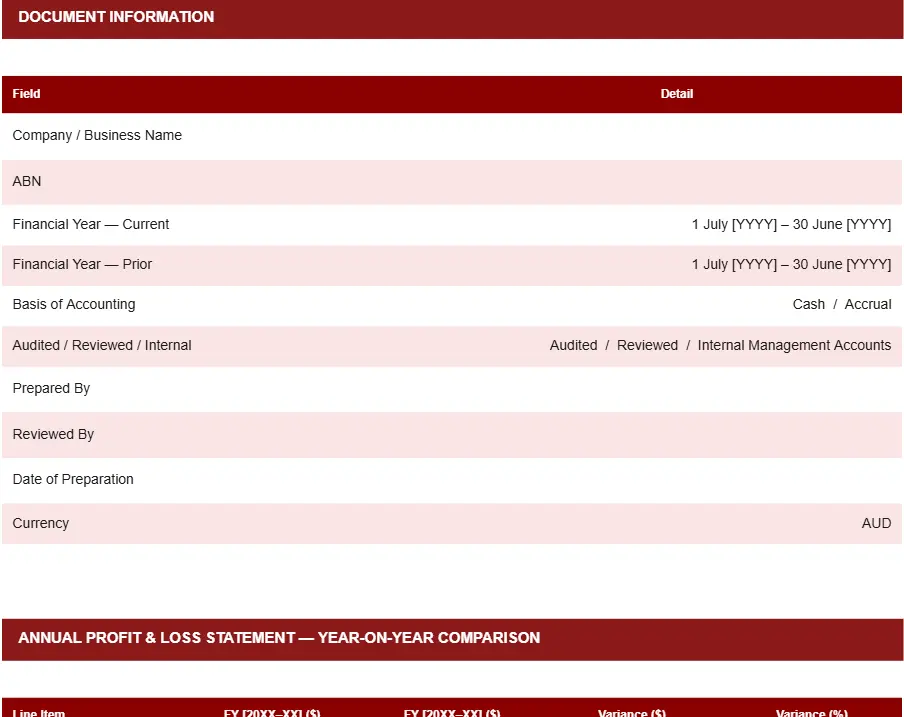
5. Annual P&L template
Summarises full-year financial performance, commonly used for tax reporting and strategic review.
ANNUAL PROFIT AND LOSS TEMPLATE
How to Read and Analyse Your P&L
Reading a profit and loss statement goes beyond checking the final profit figure. It involves understanding how revenue, costs, and expenses interact to shape overall performance.
By analysing trends and margins, businesses can identify whether profitability comes from strong sales, cost control, or temporary factors. This helps support more accurate planning and better financial decisions.
Key indicators such as gross profit margin and expense ratios provide deeper insight into operational efficiency. Tracking these over time allows businesses to detect issues early and adjust strategies before they impact performance.
Common Mistakes That Distort Your P&L
Mistakes in preparing or interpreting a P&L can lead to inaccurate conclusions and poor decision-making. These errors often come from inconsistent recording or misunderstanding financial data.
- Including GST in revenue
Recording GST as income inflates revenue and distorts actual profitability. - Forgetting superannuation as an expense
Missing employer super obligations can understate total costs. - Confusing profit with cash flow
A profitable business may still face cash shortages, making managing business cash flow critical.
Best Practices to Automate P&L Reporting
Automating profit and loss reporting reduces manual effort and improves accuracy across financial records. Consistent automation helps businesses maintain reliable data without depending on manual input.
1. Integrate your accounting system with live data sources
Connecting your accounting system to live bank feeds and payroll platforms ensures transactions are captured automatically. This removes the need for manual data entry across reporting periods.
2. Schedule automated report generation
Set your system to generate P&L reports at fixed intervals such as monthly or quarterly. Scheduled reports ensure consistent data is available for review without additional effort each cycle.
3. Use accounting software to centralise financial reporting
Accounting software consolidates revenue, COGS, and expense data into a single reporting environment. It automates calculations, applies correct GST treatment, and produces structured P&L outputs.
Teams can review real-time figures across reporting periods without rebuilding reports manually. This supports faster decision-making and reduces the risk of errors in financial data.
4. Set alerts for unusual expense movements
Automated alerts flag unexpected cost increases or revenue drops before they affect the bottom line. Early detection allows finance teams to investigate and act without waiting for end-of-period review.
5. Reconcile P&L data against BAS and payroll records
Regular reconciliation between your P&L, BAS lodgements, and payroll reports confirms data consistency. It also reduces compliance risk during tax periods and external audits.
Compliance and Financial Reporting Context
Profit and loss statements must follow financial reporting practices and Australian tax requirements to ensure accuracy and compliance, including proper GST treatment, consistent reporting periods, and correct income classification.
Businesses also need to reconcile their P&L with obligations such as BAS lodgements and payroll reporting. Maintaining clear and consistent records helps support audits, tax submissions, and overall financial transparency.
Conclusion
A profit and loss statement helps businesses understand performance beyond surface-level numbers. By analysing income, costs, and margins, it becomes easier to identify opportunities, control expenses, and improve profitability.
To make the most of your financial data, using the right tools and structure is essential. You can get advices from our experts to improve your financial reporting and decision-making.

Frequently Asked Questions About Profit and Loss Statements
-
How often should a profit and loss statement be prepared?
Most businesses prepare profit and loss statements monthly or quarterly to monitor performance, while annual reports are used for tax and strategic review.
-
Can small businesses use a simple P&L format?
Yes. Small businesses often use simple P&L formats to track income and expenses without complex breakdowns, making it easier to manage daily operations.
-
What is the difference between gross profit and net profit?
Gross profit is revenue minus the cost of goods sold, while net profit is the final amount after deducting all expenses, interest, and taxes.
-
Why is a profit and loss statement important for decision-making?
It provides insight into profitability, cost structure, and performance trends, helping businesses make informed financial and operational decisions.


