
Modern organizations generate large volumes of data from sales, operations, customer interactions, and financial activities. However, raw data alone cannot deliver meaningful insights without proper analysis.
Without structured analytics, leaders may struggle to understand performance trends or detect operational issues. This can lead to decisions based on assumptions rather than reliable data.
Business intelligence helps transform raw data into actionable insights. By using analytics tools and dashboards, organizations can monitor performance and support more informed decision making.
Key Takeaways
Understand what business intelligence is and how analytics tools transform raw data into actionable insights.
Learn the core components of a business intelligence system including data integration, warehousing, and dashboards.
Explore how business intelligence works through data collection, integration, analysis, and visualization.
Discover the step-by-step approach to implementing business intelligence to support data-driven decision-making.

What Is Business Intelligence?
Business intelligence (BI) refers to the technologies, processes, and strategies used to collect, analyze, and present business data. Its main objective is to help organizations make better decisions based on reliable information.
Through reporting tools, dashboards, and analytics platforms, BI systems allow managers to monitor performance and identify trends. This enables companies to move from intuition-based decisions toward a more data-driven strategy.
Data vs Information vs Intelligence
To understand business intelligence, it is important to distinguish between data, information, and intelligence. Data consists of raw facts such as individual sales transactions, website visits, or inventory records.
Information is created when data is organized and summarized to provide context, such as monthly sales reports or customer purchase trends. Intelligence goes one step further by analyzing that information to uncover insights that guide business strategy.
The Evolution of Business Intelligence
The concept of business intelligence has evolved significantly alongside advancements in information technology. Early BI systems focused mainly on static reports generated from centralized databases.
Modern BI platforms now provide interactive dashboards, cloud-based analytics, and self-service reporting tools. These developments allow employees across different departments to access and analyze data without requiring advanced technical skills.
How Business Intelligence Connects with ERP Systems
Business intelligence tools rely heavily on data generated by enterprise systems such as Enterprise Resource Planning (ERP) platforms. ERP systems collect operational data from departments including finance, sales, procurement, and human resources.
BI solutions analyze this centralized data to create dashboards and performance reports that support strategic planning. By combining ERP data with analytics tools, organizations gain a clearer and more comprehensive view of their overall business performance.
Key Components of a Business Intelligence System
A business intelligence system is not a single tool but a collection of technologies that work together to transform raw data into insights. These components manage data collection, storage, analysis, and visualization across the organization.
Understanding these core elements helps organizations design a BI architecture that supports reliable analytics and effective decision-making.
Data Sources and Data Integration
Business intelligence systems collect data from multiple internal and external sources. These may include ERP platforms, CRM systems, HR software, financial applications, and third-party market data.
Data integration tools combine these sources into a unified dataset. This ensures that analytics platforms work with consistent and reliable information across departments.
Data Warehousing
A data warehouse serves as the central repository for business intelligence data. It stores structured information from different systems in a format optimized for analysis.
Unlike operational databases that handle daily transactions, data warehouses focus on historical data and large analytical queries. This enables organizations to identify trends and evaluate long-term performance.
Reporting and Dashboards
Reporting tools transform processed data into structured summaries that track business performance. These reports often focus on key operational metrics such as revenue, expenses, or sales performance.
Dashboards provide a more interactive view of data by displaying real-time key performance indicators. Users can filter, explore, and analyze metrics directly within the dashboard interface.
Data Visualisation Tools
Data visualization tools convert complex datasets into visual formats such as charts, graphs, and maps. Visual representation helps users quickly understand trends and relationships in the data.
Effective visualization reduces the effort required to interpret large datasets. As a result, decision-makers can identify patterns and insights more efficiently.
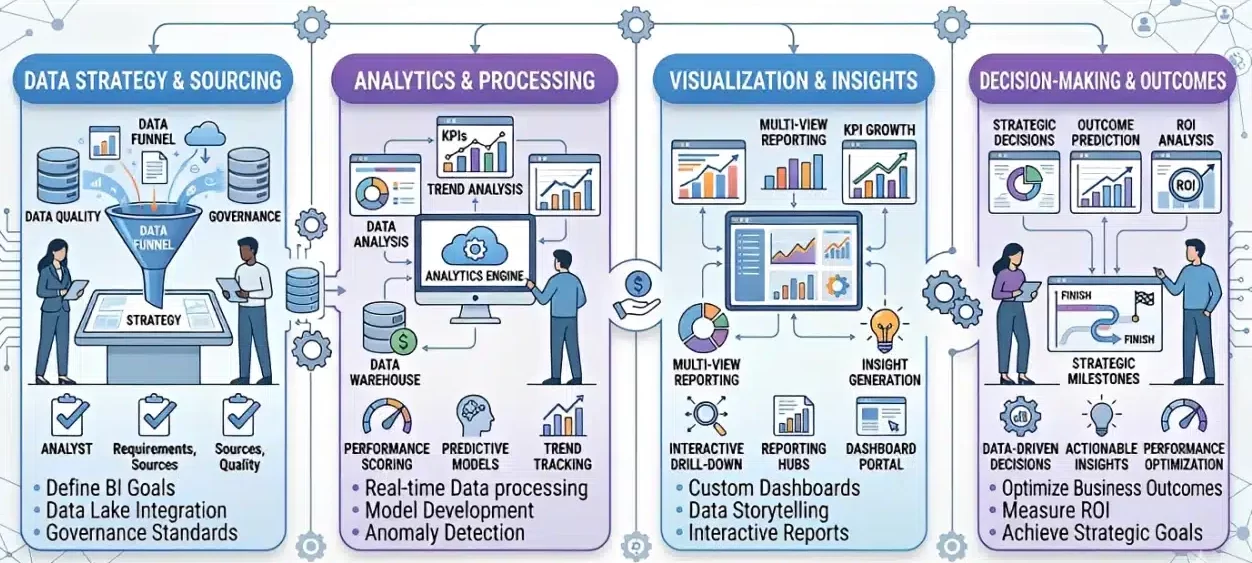
How Business Intelligence Works
Business intelligence operates through a structured lifecycle that transforms raw data into actionable insights. This process ensures that data is collected, cleaned, analyzed, and delivered to decision-makers in a usable format.
By following this lifecycle, organizations can maintain data accuracy while continuously improving their analytical capabilities.
Step 1: Collect and Centralise Data
The first step in the BI process is gathering data from various operational systems across the organization. This may include sales platforms, finance software, supply chain systems, and external data sources.
Once collected, the data is centralized within a unified platform or data warehouse. This centralization ensures that all analytics processes rely on consistent datasets.
Step 2: Clean and Integrate Data
Raw data often contains inconsistencies, duplicates, or missing values. Before analysis can begin, this data must be cleaned and standardized.
Data integration tools then combine information from multiple sources into a unified structure. This step ensures that analytics results remain accurate and reliable.
Step 3: Analyse and Visualise Insights
After data is prepared, analysts and BI tools begin examining the dataset to identify trends and patterns. Analytical models help answer questions about performance, customer behavior, or operational efficiency.
The insights generated are then presented through dashboards, charts, and reports. These visual tools make complex data easier to understand and interpret.
Step 4: Inform Decisions and Take Action
The final stage of business intelligence involves applying insights to business decisions. Managers and executives use BI dashboards to evaluate performance and guide strategic planning.
By turning insights into action, organizations can improve operational efficiency and respond more quickly to changing market conditions.
Business Intelligence Use Cases Across Industries
Business intelligence can be applied across many industries to improve operational efficiency and decision-making. By analyzing data from different business processes, organizations gain insights that help them respond quickly to market changes.
Although the technology is similar, the way BI is used often varies depending on industry needs. Each sector focuses on different metrics, operational challenges, and performance indicators.
Retail and E-commerce Analytics
Retail and e-commerce companies rely on business intelligence to understand customer behavior and optimize product offerings. By analyzing sales data, website activity, and purchasing trends, retailers can identify high-demand products and adjust inventory levels accordingly.
BI tools also help businesses personalize marketing campaigns and improve pricing strategies. These insights allow retailers to increase conversion rates while maintaining efficient stock management.
Manufacturing and Operational Intelligence
Manufacturers use business intelligence to monitor production efficiency and manage supply chains. Data from factory equipment, production schedules, and logistics systems helps identify bottlenecks and optimize operations.
BI dashboards also support predictive maintenance by analyzing machine performance data. This reduces unexpected equipment failures and improves overall production reliability.
Healthcare Data Analytics
Healthcare organizations generate large amounts of operational and clinical data. Business intelligence systems help hospitals analyze patient records, treatment outcomes, and administrative processes.
These insights support better resource allocation and improved patient care. BI also helps healthcare providers monitor performance metrics such as patient readmission rates and service efficiency.
Financial Services and Risk Management
Financial institutions rely on business intelligence to monitor transactions, assess financial risks, and detect fraudulent activity. By analyzing large datasets, BI tools can identify unusual patterns that indicate potential security threats.
Banks and investment firms also use BI to evaluate market trends and customer financial behavior. This helps them make more accurate lending, investment, and risk management decisions.
Logistics and Transportation Analytics
Logistics companies use business intelligence to optimize route planning, track shipments, and manage fleet performance. Data from GPS systems, fuel consumption records, and delivery schedules provides insights into operational efficiency.
By analyzing these datasets, companies can reduce transportation costs and improve delivery accuracy. BI dashboards also help logistics managers monitor real-time supply chain performance.

Step-by-Step Guide to Implementing Business Intelligence
Implementing business intelligence requires more than adopting analytics tools. Organizations must align their data infrastructure, processes, and teams to support effective data analysis.
A structured implementation strategy helps businesses ensure that BI systems deliver accurate insights and support long-term decision-making.
Step 1: Define Clear Business Objectives
The first step in implementing business intelligence is identifying the key business goals that the system should support. Organizations must determine what problems they want to solve or which performance indicators they want to monitor.
Clear objectives help guide the design of dashboards, analytics models, and reporting structures. This ensures that BI tools focus on delivering insights that support real business needs.
Step 2: Audit and Clean Data Sources
Before implementing BI tools, organizations must review their existing data sources. Data may come from multiple systems such as ERP platforms, CRM software, marketing tools, or spreadsheets.
Cleaning and standardizing this data is essential for accurate analysis. High-quality data ensures that business intelligence reports reflect real operational performance.
Step 3: Select the Right BI Platform
Choosing the right BI platform depends on the organization’s technical requirements and scalability needs. Some companies prefer cloud-based analytics platforms, while others require on-premise systems for security reasons.
A suitable platform should support easy data integration, intuitive dashboards, and strong visualization capabilities. These features help ensure that users can access insights quickly and efficiently.
Step 4: Design the Data Architecture
A reliable BI system requires a well-structured data architecture. This typically includes data warehouses or data lakes that store integrated information from different systems.
Organizations must also implement data pipelines that automatically collect and update datasets. A well-designed architecture ensures consistent and reliable analytics performance.
Step 5: Train Users and Drive Data Adoption
The success of business intelligence depends heavily on user adoption. Employees must understand how to access dashboards, interpret reports, and apply insights to their daily work.
Organizations should provide training programs that improve data literacy across departments. Encouraging a culture of data-driven decision-making helps maximize the value of BI investments.
Common Business Intelligence Pitfalls to Avoid
Although business intelligence offers many benefits, organizations often encounter challenges during implementation. Understanding common mistakes can help companies avoid costly setbacks and improve the effectiveness of their BI initiatives.
Several pitfalls frequently appear when companies adopt BI systems without proper planning or governance.
- Treating BI purely as an IT project
Business intelligence should be driven by business objectives rather than technical implementation alone. When BI initiatives are handled only by IT teams, dashboards may fail to reflect real operational needs. - Poor data quality and governance
BI insights depend heavily on the accuracy and consistency of the underlying data. Without proper data governance and cleansing processes, organizations risk generating misleading reports. - Lack of user training and adoption
Even the most advanced BI platform cannot deliver value if employees do not use it effectively. Organizations must invest in training programs that improve data literacy across departments. - Dashboard clutter and information overload
Overloaded dashboards filled with excessive charts and metrics can confuse decision-makers. Effective BI dashboards focus only on the most relevant KPIs that support specific business goals.
Advanced Trends Shaping the Future of Business Intelligence
Business intelligence technologies continue to evolve as organizations demand faster and more advanced analytics capabilities. Emerging trends are expanding the role of BI from simple reporting to predictive and automated decision support.
These innovations are helping organizations gain deeper insights while improving the speed and accuracy of business decisions.
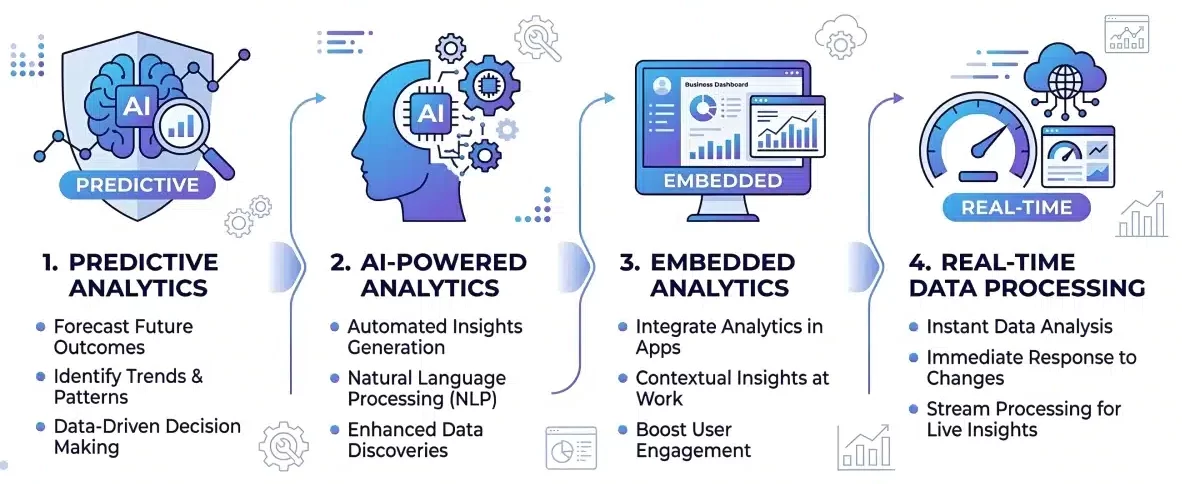
Predictive and Prescriptive Analytics
Predictive analytics uses historical data and statistical models to forecast future trends and outcomes. Organizations can anticipate customer demand, detect potential risks, and prepare strategies based on data-driven forecasts.
Prescriptive analytics goes further by recommending specific actions to achieve desired results. By combining predictive insights with optimization algorithms, companies can identify the best strategic decisions.
Augmented Analytics with AI and Machine Learning
Augmented analytics integrates artificial intelligence and machine learning into business intelligence platforms. These technologies automate complex tasks such as data preparation, pattern detection, and insight generation.
Natural language processing also allows users to query data using everyday language. This makes advanced analytics more accessible to employees without technical backgrounds.
Embedded Analytics in Enterprise Applications
Embedded analytics integrates BI dashboards directly into enterprise software applications. Instead of accessing a separate analytics platform, users can view insights within the tools they already use daily.
This approach improves efficiency by placing analytics directly within operational workflows. As a result, decision-makers can act on insights faster without interrupting their tasks.
Real-Time Analytics and Edge Computing
Real-time analytics enables organizations to analyze data immediately as it is generated. This capability is particularly valuable in industries that require rapid decision-making, such as finance, logistics, and manufacturing.
Edge computing further enhances this process by analyzing data closer to where it is produced. This reduces latency and allows businesses to respond quickly to operational changes.
Measuring the Impact of Business Intelligence
Measuring the impact of business intelligence helps organizations evaluate whether their analytics initiatives deliver meaningful value. Without clear performance indicators, it becomes difficult to assess the effectiveness of BI systems.
By tracking specific metrics, companies can identify how BI contributes to operational efficiency and strategic decision-making.
Operational Performance Metrics
Operational metrics evaluate how BI systems improve day-to-day business processes. These indicators often include productivity levels, process efficiency, and operational cost reductions.
Monitoring these metrics helps organizations determine whether BI tools are improving workflow performance across departments.
Data-Driven Decision Making Indicators
Another important measurement focuses on how frequently data is used in decision-making processes. Organizations may track dashboard usage rates, report access frequency, or the number of decisions supported by analytics.
High adoption of BI dashboards often indicates that employees trust the data and rely on it for strategic planning.
Business Growth and Strategic Outcomes
Business intelligence can also be evaluated through broader strategic results such as revenue growth, customer retention, and market expansion. These outcomes demonstrate how analytics contributes to long-term organizational success.
By linking BI insights to measurable business improvements, companies can justify continued investment in data-driven technologies.
Conclusion
Business intelligence enables organizations to transform raw data into insights that support smarter decision-making. With the right analytics tools, companies can monitor performance, identify trends, and respond quickly to operational challenges.
A structured BI framework also improves data accuracy, reporting efficiency, and cross-department visibility. When combined with strong data governance and user adoption, business intelligence becomes a key driver of strategic growth.
If your organization wants to implement analytics that supports better decision-making, the right system can make a significant difference. Request a free consultation with our experts to explore business intelligence solutions that help transform data into actionable insights.

Frequently Asked Questions About Business Intelligence
-
What is business intelligence?
Business intelligence (BI) refers to technologies and processes used to collect, analyze, and visualize business data. BI tools help organizations transform raw data into insights that support strategic decision-making.
-
Why is business intelligence important for companies?
Business intelligence helps companies monitor performance, identify trends, and make data-driven decisions. By analyzing operational data, organizations can improve efficiency and respond faster to market changes.
-
How does business intelligence work?
Business intelligence works by collecting data from multiple systems, cleaning and integrating the data, analyzing patterns, and presenting insights through dashboards or reports.
-
What tools are commonly used for business intelligence?
Common BI tools include data warehouses, analytics platforms, reporting systems, and dashboard visualization software that help users explore and interpret business data.
-
What industries use business intelligence?
Business intelligence is used across many industries including retail, manufacturing, healthcare, finance, and logistics to improve decision-making and operational efficiency.


